
By Amanda Randles, PhD
Exciting advances in establishing metrics to quantify underlying structure in vascular red blood cell distributions1 will enable us to track individual cancer cells as they travel through crowded blood vessels, randomly careening with red blood cells on their journey through a patient’s body.
Why quantify cellular motion in blood flow
Until recently, producing an accurate representation of complex cellular motion and interactions throughout the elaborate anatomy of the circulatory system was beyond our reach. In the last few decades, we have seen an astounding increase in computational power and the ability to leverage large-scale supercomputers to capture realistic, 3D simulations of cellular models in the vasculature.2,3 Now that we have the computational capability to successfully simulate the interactions of hundreds of millions of cells, the question turns to how we can use these realistic models to provide meaningful results.
Building on these advances, our team led by graduate student Sayan Roychowdhury, is working to use computational models to provide much-needed insight into the mechanics driving cancer cell transport. Predicting the path of a tumor cell allows us to know where it will likely arrive at a blood vessel wall and latch on to establish a secondary tumor site. Our bodies contain an intricate system of 60,000 miles of arteries, veins, and capillaries—a delicate network of vessels filled with over 25 trillion red blood cells. The specific path of a single tumor cell moving through this complicated and crowded superhighway depends on its random interaction with each group of red blood cells it meets along the way.
For example, imagine yourself trying to make your way through a crowded shopping mall during the peak of the holiday shopping season. You are constantly changing course to avoid bumping into people and altering direction when you accidentally step into someone else’s path. The way you progress through the mall’s packed corridors or a store’s congested aisles varies depending on how many people are around you, who they are, and where they are standing. Similarly, the cancer cell’s trajectory through any region of the circulatory system will be influenced by the location of cells around it, the type of those cells, and their individual orientations. The positions of the surrounding cells are never static. At any given point in time, the same location in space can be occupied by a completely different set of cells.
To understand the general motion of the cancer cell, a single simulation is inadequate for capturing the variation in cancer cell trajectory. On the other hand, simulating a cancer cell a million times with slightly perturbed neighboring cell positions is clearly untenable. Thus, a means of intelligent sampling is needed to determine how many different representations and orientations need to be simulated to adequately sample the space and provide meaningful results.
We needed many cell configurations to determine all possible trajectories of a cancer cell, but we didn’t know how many would be enough. So, we set out to determine a method of identifying randomly placed cell distributions and quantifying distinct cell configurations. But first, we had to develop specific ways to measure and describe all the different patterns representing the ways red blood cells are positioned in a group.
Supercomputer simulations
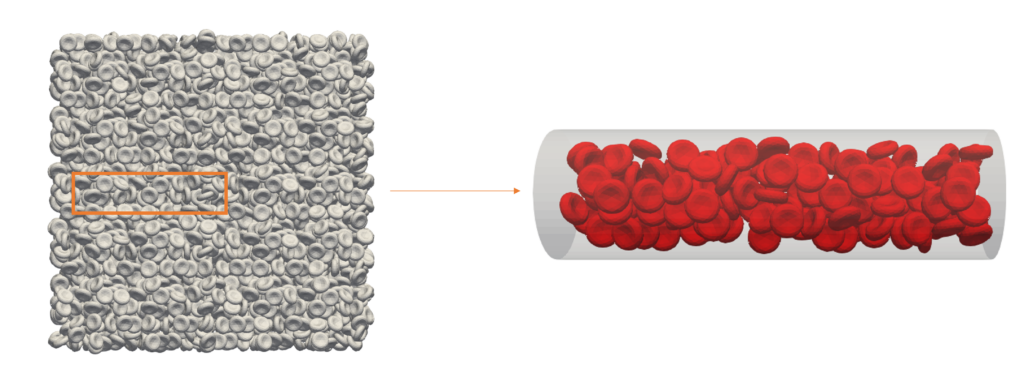
First, we generated a computer simulation of a large system packed with red blood cells before introducing a three-dimensional blood vessel into the simulation. The vessel was placed in the system and all the red blood cells that fit inside were saved in terms of location and orientation in space, to create a particular configuration. We generated several of these red blood cell configurations by refilling the vessel at different locations through the system.
Then, we applied the radial distribution function—the formula researchers commonly use to calculate randomness within a dense distribution in molecular dynamics models. This function confirmed the realistic, random placement and spacing of red blood cells in our simulation.
The next part of our investigation was focused on coming up with a method to numerically compare all the generated configurations. We applied the Jaccard index, a quantitative metric used to measure the similarity between sample sets, to determine if the groupings of red blood cells were distinct by comparing the amount of volume that each configuration shared in space. This required us to map the biconcave red blood cell shapes onto 3D grid points and calculate shared points for all the patterns. In the end, we were left with a calculable value to describe their similarities.
We found that, beyond a certain point, increasing the number of different red cell groupings does not significantly change the probability distribution. In fact, the distribution grew more predictable with higher numbers. As we watched the red blood cells randomly crowd through a cylinder narrower than a single strand of hair and shorter than a computer monitor’s pixel, we observed 72 unique configurations and concluded it was a sufficient size to predict parameters accurately for this vessel.
Due to the random pattern of red blood cell distribution, we needed a way to sample the full array of distributions if we hope to ascertain individual cell behavior. We established numerical methods to quantitatively measure and describe an array of cell distributions. This brings us one step closer to determining the set of cell distributions that best describes the entire assortment of possibilities.
Future directions
We hope, intelligently sampling cell configurations will allow us to utilize expensive supercomputer simulations more efficiently. This research is possible thanks to a code we developed, HARVEY,4 in 2013 to measure blood flow dynamics. We have optimized it to run efficiently on some of the world’s largest supercomputers.5 Over time, the use of high-performance computing has become more useful in biomedical research.
Simulations have given us new insights into disease progression and drug response. Further advances in biomedicine await our enhanced understanding of high-performance computers. Today, the fields of biomedicine and high-performance computing are inextricably intertwined. We can now simulate the movement and behavior of hundreds of millions of red blood cells simultaneously. With this new ability, we must answer the question of how we can use this information to draw real-world conclusions. The behavior of cells inside a blood vessel is just one application of this technology. We can simulate particles, atoms, and cells in a variety of situations.
References
- Roychowdhury, Sayan, Erik W. Draeger, and Amanda Randles. “Establishing Metrics to Quantify Underlying Structure in Vascular Red Blood Cell Distributions.” International Conference on Computational Science. Springer, Cham, 2022.
- Rossinelli, Diego, et al. “The in-silico lab-on-a-chip: petascale and high-throughput simulations of microfluidics at cell resolution.” Proceedings of the International Conference for High Performance Computing, Networking, Storage and Analysis. 2015. https://doi.org/10.1145/2807591.2807677
- Ames, Jeff, et al. “Multi-GPU immersed boundary method hemodynamics simulations.” Journal of computational science 44 (2020): 101153. https://doi.org/10.1016/j.jocs.2020.101153
- Randles, Amanda Peters, et al. “Performance analysis of the lattice Boltzmann model beyond Navier-Stokes.” 2013 IEEE 27th International Symposium on Parallel and Distributed Processing. IEEE, 2013. https://doi.org/10.1109/IPDPS.2013.109
- Randles, Amanda, Erik W. Draeger, and Peter E. Bailey. “Massively parallel simulations of hemodynamics in the primary large arteries of the human vasculature.” Journal of computational science 9 (2015): 70-75. https://doi.org/10.1016/j.jocs.2015.04.003
Amanda Randles, PhD, is the Alfred Winborne Mordecai and Victoria Stover Mordecai assistant professor of biomedical sciences at Duke University and an NAI (National Academy of Inventors) fellow.


