When performing 1D and 2D gel electrophoresis within your laboratory, you doubtlessly pay a great deal of attention to your experimental design, sample preparation, and technical execution, likely in accordance with a detailed standard operating procedure. However, can you say you afford the same degree of care to your image analysis process? You should. After all, this process is where all your quantifiable data is generated. In a sense, your data doesn’t come from your experiment, but from your image of your experiment.
TotalLab has been creating 1D and 2D image analysis software for the life sciences for over 20 years. During that time, we’ve gained a wealth of experience not only in bridging the gap between captured images and reliable data, but also in helping scientists and medical professionals acquire and derive value from the highest-quality images possible.
Image quality concerns
Among the factors that harm image quality (and therefore data quality), the most common is image compression. The second most common is bit-depth. We will consider each of these factors from a software and image data perspective.
Image compression: We would always recommend that you avoid applying any compression to your captured image files. Compression reduces file size by stripping data from an image. Even if there is no change in the image to the naked eye, it is the data within the image (the raw pixel values embedded in the image) where your measurements are taken from. Any removal of data from your image files may negatively impact your analysis by actually removing data from your analysis. The most common action that allows compression to sneak into your workflow is the transfer of an image from your capture device (gel documentation system, densitometer, etc.) to your analysis software or to another computer. When you export images from capture software, you should always select “export for analysis” rather than “export for publication.” And you should definitely reject the idea of just taking a screenshot of the image!
Within our software, we analyze images in grayscale format, the reason being that in grayscale images, the value of each pixel represents only the intensity of the light (and, therefore, the intensity of bands or spots). No pixel data storage space is used to store color information. False-color modes can be applied to your images to increase the contrast and help you identify fainter bands or spots. However, all of the measurements in the background are performed on the grayscale image. Most, if not all, modern gel documentation systems will allow you to export analysis images in grayscale format, which has become the industry standard.
It is advised to export the image in grayscale, rather than exporting a color image and then converting to grayscale, because a color image is divided between three different color channels—red, green, and blue (RGB). So, a 24-bit color image, which has 8 bits per channel, when converted to grayscale essentially becomes an 8-bit image with weighted averaging of the red, green, and blue channels. Hence, some pixel data could be lost or changed in the conversion process, and you may not get a true representation of your image reflected in the pixel data, where measurements are drawn from.
Low bit depth: The bit depth of an image (also referred to as color depth or pixel depth) is the number of bits used to represent each pixel in an image. In a 1-bit image, for example, each pixel is represented by just 1 bit. Such an image, then, can store only one binary value—1 or 0—which means that the image can only be either completely black or completely white.
Essentially, the bit depth is a direct measure of how much data can be stored in each individual pixel of an image, and it is this data that we read for use in our algorithms and measurements to generate results. The logical extension of this is that the greater the bit depth of an image, the more data is available for you to use and subsequently the greater the quality of your results. We recommend capturing your images in the highest bit depth settings available on your capture device, as this will allow you to use the greatest range of data and therefore the greatest sensitivity possible. The relationship between bit depth and sensitivity all comes down to the storage of binary data within pixels and how data is expressed visually in a digital image. The best way to understand this is with a diagram.
As the diagram in Figure 1 demonstrates, increasing the bit depth of an image actually produces an exponential increase in the number of values available for each pixel (and, therefore, levels of gray). As an example, an 8-bit grayscale image file can store 1 of 256 shades of gray in each pixel, but if you increase your bit depth to 16 bits, your image file now has 65,536 possible grayscale values to choose from for each pixel. This vastly increases the amount of data and level of quantitative accuracy.

Besides capturing the highest-bit-level tiff images possible, you can take a few additional actions during the capture and export steps to increase the quality of your images. These actions include ensuring that you’re using the highest resolution possible provided by your capture device. Typically, a minimum resolution of 300 dots per inch (DPI) or a pixel size below 100 microns will provide an image that is detailed enough for accurate analysis and small enough in file size for efficient processing.
Quality control checks before analysis
Once you’ve captured or received your image, but before you perform your analysis, it’s important to perform a quality control check to make sure the image is appropriate for analysis. A common problem in gel and blot images to check for is areas of saturation within the image. Most modern capture or analysis software will highlight this by default to the user, usually in a bright color. Saturation occurs when the exposure time of the gel is set too high during capture, that is, when the amount of light captured from that spot/band goes beyond the camera’s upper limit of detection.
This causes data loss as any signal above that cut-off point cannot be detected. For example, if you had a spot or band with a light intensity value of 1,000, and if your camera’s upper limit of detection was equal to 1,000, every spot or band with an intensity equal to or above 1,000 will show as being 1,000. The true intensity of those bands is lost, and the intensities of different bands cannot be quantified or compared within your experiment.
To avoid this, look at the setup of your device and make sure that your bands or spots are within the dynamic range of your preview window by reducing the exposure time. Alternatively, if you are using a laser-based system, you can fine-tune the voltage of the photomultiplier tube (PMT). The sweet spot for exposure time is when your bands or spots of interest are most visible but haven’t yet become saturated. For laser-based systems, your voltage should be set to as high as possible before saturation occurs. If you’re unsure of how best to change this, you should review your scannerdocumentation or consult your scanner supplier.
How to leverage software to save time in your laboratory
Although there are overlaps between the image capture and analysis advice given for 1D images and that given for 2D images, there are specific requirements involved when one is dealing with the spots in a 2D gel experiment instead of with the spots in a 1D gel experiment.
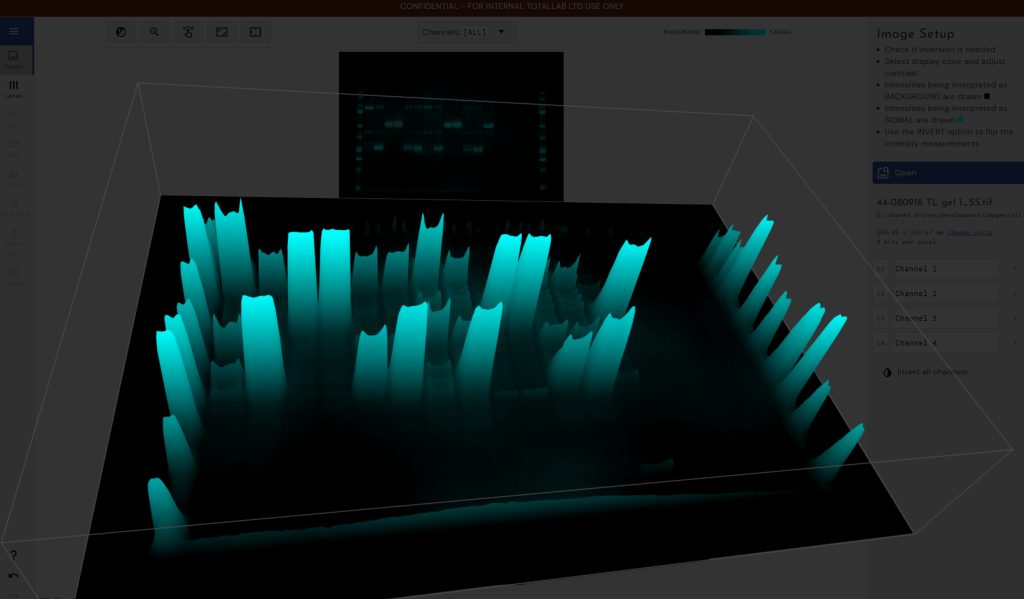
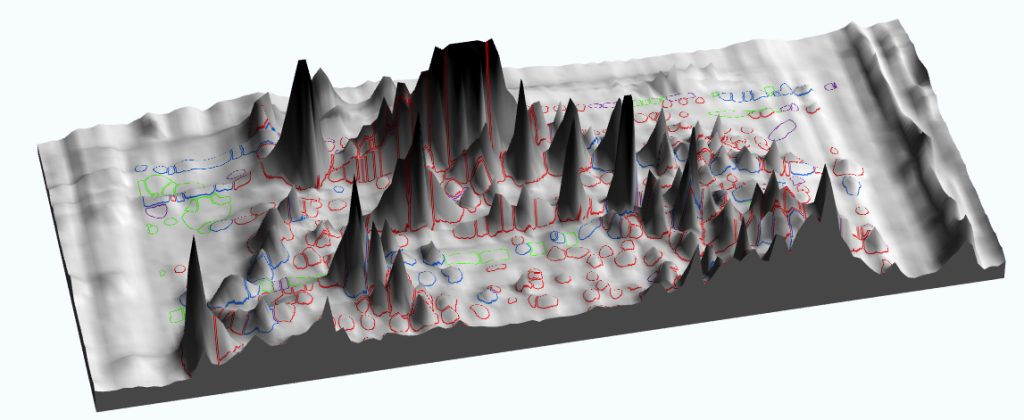
The specific requirements for 2D gels include two additional Figure 2A. Imaging software may be used to model 1D and 2D gels in three dimensions, improving analyses and generating striking images for publication. Figure 2B. This 3D image was generated with SpotMap, TotalLab’s host cell protein coverage analysis software. The software draws outlines accurately, and it produces 3D views that can be used to validate legacy software for host cell protein coverage workflows—one for image alignment, and one for spot counting and measurement. Both can take a considerable amount of an operator’s time. Software that enables users to automatically align 2D gel and blot images on top of each other and automatically detect spots can save a huge amount of time and also increase accuracy by reducing inter-operator variability.


Software that provides pixel-level auto-alignment (to account for the inherent geometric distortions involved in 2D gel electrophoresis) is capable of inserting hundreds of separate vectors for alignment in different parts of your images in approximately 10 seconds. To manually insert the same number of alignment vectors would take hours.
There are, of course, instances where manual intervention is preferred, and if this is the case, it’s important that your choice of software also provides intelligent manual features, such as giving users the ability to snap to spots between images. Other manual features that allow you to check the accuracy of your alignment are also important. An industry standard is the use of an image checkerboard, which is made up of alternating sections of your two images. When the edges of the squares line up with each other, your two images are aligned.
Enriching your data after your experiment
The right image analysis software can expand the information you can glean from your experiments and facilitate the visualization of relationships embedded in image data. For example, it can be used to model 1D and 2D gels in three dimensions and produce some stunning imagery for inclusion in publications and presentations (Figures 2A & 2B). Exercising image annotation abilities (which include the sharing of annotated images across laboratory users for further analysis and discussion) is a great way to ensure cross-collaboration (Figure 3).

Laboratories operating in a regulated environment don’t need to sacrifice these capabilities when they use image analysis software. They can opt for solutions that have secure sign-in, full audit trails, and electronic signatures. They can also gain the ability to prepare reports of this data to ensure compliance with 21 CFR part 11 regulations.
Confidence in the reproducibility of your results, across replicates and operators, can be ensured by using software that supports robust and simplified workflows. Most important, the software needs to have been designed to be easy to use. Such software can minimize the time spent training new users and prevent user error.
Although the quality of the data you extract from 1D gel, 2D gel, and immunoblotting experiments depends on your practical setup, the images you capture of your experiment are just as important. By ensuring that your choice of analysis software is well informed, and by investing in something that has been developed from the ground up with operators and laboratories in mind, you can ensure a consistently high level of image and data analysis across operators and gel documentation systems in your laboratory.
Steven Dodd, PhD, is head of sales and business development at TotalLab.


Comments are closed.