
September 1, 2018 (Vol. 38, No. 15)
Xiaofeng (Kevin) Han Ph.D. Senior Research Scientist Eppendorf
Ma Sha Ph.D. Director of Technical Applications Eppendorf
Ulrike Becken Scientific Communication Manager Eppendorf AG Bioprocess Center
Strong demand for vaccines for viral diseases requires that manufacturing techniques become more productive, including those based on scalable bioreactor cell culture systems. In viral vaccine production, Vero is one of the most widely used cell lines.1 Because these cells are anchorage dependent, they require a growth support when they are cultivated in stirred-tank bioreactors. For high-density Vero cell culture processes, an attachment matrix incorporating Fibra-Cel® disks shows promise.
The disks are made of polyester and polypropylene fibers, which provide a three-dimensional environment, offering a high surface-to-volume ratio and protecting cells from damaging shear forces. In combination with a basket impeller, a packed-bed bioreactor system is formed, which enables the exchange of growth medium and harvest of the end product in perfusion processes, without the need for cell filtration.
In this study, we cultivated Vero cells in perfusion mode in Eppendorf BioBLU® 5p Single-Use Vessels with a built-in basket impeller prepacked with Fibra-Cel (Figure 1). We achieved a high cell density of approximately 43 million cells/mL, demonstrating great potential for Vero cell–based vaccine production using Fibra-Cel packed-bed vessels.
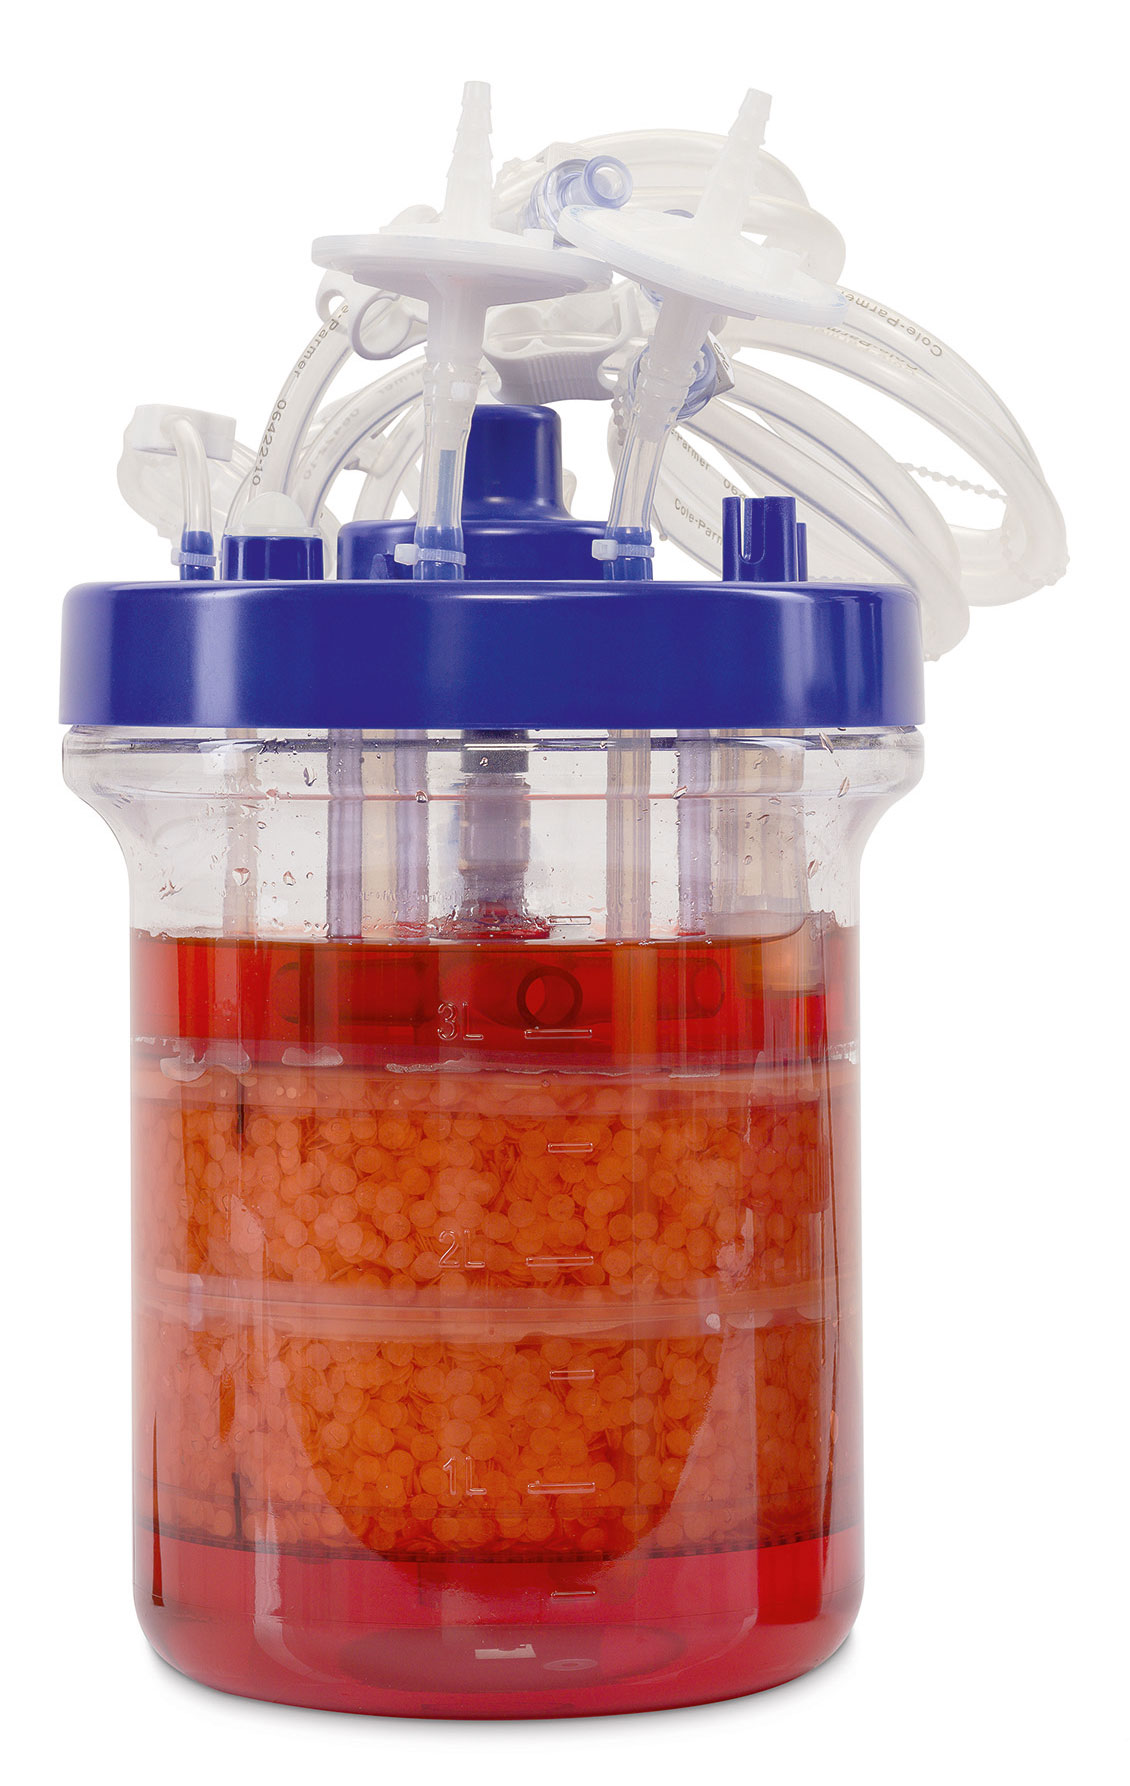
Figure 1. BioBLU 5p Single-Use Vessel
Materials and Methods
Cell Line and Medium
We cultivated adherent Vero cells (ATCC, CCL-81TM) in Dulbecco’s modified Eagle’s medium (DMEM) (Thermo Fisher Scientific), supplemented with 1× Antibiotic-Antimycotic (Thermo Fisher Scientific) and 1% (v/v) heat-inactivated fetal bovine serum.
Growth Surface
We cultivated Vero cells in a BioBLU 5p Single-Use Vessel with a working volume of 3.5 L. Each BioBLU 5p contains 150 g of Fibra-Cel disks. These provide a growth surface of 180,000 cm2, which is equivalent to about 212 roller bottles, or 29 10-layer, stacked-plate, cell culture vessels.2
Bioprocess Control
The bioprocess was controlled with a BioFlo® 320 bioprocess control station. The BioBLU 5p Single-Use Vessel was inoculated with 530 mL of inoculum, which had a cell density of 3.0 × 10⁶ cells/mL and a cell viability of 99%, resulting in an inoculation density of 4.6 × 10⁵ cells/mL. The cells were cultivated at 37°C.
Dissolved oxygen (DO) was measured using a polarographic ISM® sensor (Mettler Toledo). DO was controlled at 50% by automatic gassing at a flow of 0.002 – 0.5 SLPM in the 3-Gas Auto mode via a macrosparger. To reduce foaming caused by high gas flow in the late culture stage, we limited air flow to 0.002–0.2 SLPM and oxygen flow to 0–0.5 SLPM.
The BioBLU 5p Single-Use Vessel was equipped with an optical pH sensor and the pH was controlled at 7.1 (deadband = 0.1) via a cascade of CO2 (acid) and 0.45 M sodium bicarbonate (base). The culture was agitated at 100 rpm. We added Antifoam C Emulsion (Sigma-Aldrich) when it was needed.
Feeding and Perfusion Control
We started with a perfusion rate of 0.2 vessel volumes per day (VVD) and gradually increased it to 1.5 VVD at the end of the run. We determined the perfusion rate by monitoring metabolite levels with a Cedex® Bio Analyzer (Roche Diagnostics). The goal was to keep the ammonium concentration below 4 mM and the glucose concentration between 2 and 4 g/L.
In addition to perfusion, we performed extra glucose bolus feeding (200 g/L glucose stock solution) based on the glucose level in the bioreactor at the end of every day. The aim was to bring the glucose level in the bioreactor close to the glucose concentration in the perfusion medium (4.7 g/L) at the beginning of the next day. We also determined lactate and glutamine levels daily.
Cell Growth
In the packed-bed bioreactor, the Vero cells cannot be counted directly during the culture because the cells adhere to the Fibra-Cel disks. To obtain an indirect measure of cell growth, we analyzed the glucose consumption of the culture.
The rate of glucose consumption (R) in grams per day can be calculated based on the total glucose added to the bioreactor minus the residual glucose. The daily total amount of glucose added to the bioreactor is therefore equal to the amount of glucose in the vessel at the start of the day (Gvessel-start) combined with the glucose supplied through perfusion (Gperfusion) and the extra glucose added via bolus feed (Gbolus). By subtracting the amount of glucose remaining in the vessel at the end of the day (Gvessel-end) as well as the amount of glucose remaining in the harvested perfusate (Gharvest), we arrive at the amount of glucose consumed (g) per day (24 h). The daily glucose consumption rate is represented by the following equation:
R = (Gvessel-start + Gperfusion + Gbolus −
Gvessel-end − Gharvest) / day
The glucose amount in the vessel at the start and the end of the day can be calculated by multiplying the glucose concentration in the medium by the working volume. The amount of glucose added by bolus feed can be calculated based on the concentration of the glucose stock solution and the volume of the bolus feed. The amount of glucose supplied through perfusion can be calculated based on the glucose concentration in the perfusion medium and the perfusion volume. The amount of glucose remaining in the harvested perfusate can be calculated based on its volume.
In addition, we directly measured the cell number at the end of the cell culture run by counting nuclei using a crystal violet nuclei counting assay (Chemglass Life Sciences, CLS-1332-01). We cut the vessel open below the head plate and collected Fibra-Cel samples from two different locations in the basket. We extracted the cell nuclei, stained them with crystal violet, and counted them using a Vi-CELL® XR Cell Viability Analyzer (Beckman Coulter) as described previously.2
Results
Confirming Cell Attachment
To assess Vero cell attachment on the Fibra-Cel disks, we took a culture sample 30 minutes after inoculation. No cells were observed in suspension, indicating that the Vero cells had attached to the Fibra-Cel disks rapidly. We started the perfusion on day 3, because the glucose level became low and the concentration of the toxic byproducts lactate and ammonium increased.
Tracking Glucose Consumption
Using an indirect measure of cell growth, we tracked the glucose consumption rate of the culture (Figure 2A). We calculated the total glucose consumption of the culture and the daily glucose consumption rate.
For the first four days, the daily glucose consumption rates were around 2.7 g/day, indicating that cells were in lag phase. From day 5, the glucose consumption rate started to increase to 4.4 g/day, and even doubled to 9.7 g/day on day 6, indicating that cell growth had entered the log phase. Cells were growing continuously, and the glucose consumption rate doubled again to 19.4 g/day on day 17. On the last day of the run, the glucose consumption rate was still increasing, reaching 22.4 g/day. In total, the cells consumed 273 g glucose during the 21 days.
Calculating Vero Cell Growth Curve
At the end of the process, we determined the cell number by counting nuclei. For one Fibra-Cel disk sample, the average cell count was 4.43 × 10⁶ cells. From this number, we extrapolated the total number of cells in the culture as described previously.2 As a result, the total number of Vero cells in the BioBLU 5p vessel at the end of the perfusion culture was calculated as 1.51 × 10¹¹ cells. The final cell density at the end of the culture, based on the 3.5-L working volume, was 4.31 × 10⁷ cells/mL.
Based on the cell density at the end of the culture (4.31 × 10⁷ cells/mL) and the glucose consumption rate on the last day (22.37 g), we obtained the glucose-consumption-to-cell-density conversion ratio at the end of the culture. Assuming that this conversion ratio remained relatively unchanged over the duration of the culture, we converted the daily glucose consumption rate into daily cell density. The calculated Vero cell growth curve is shown in Figure 2B.
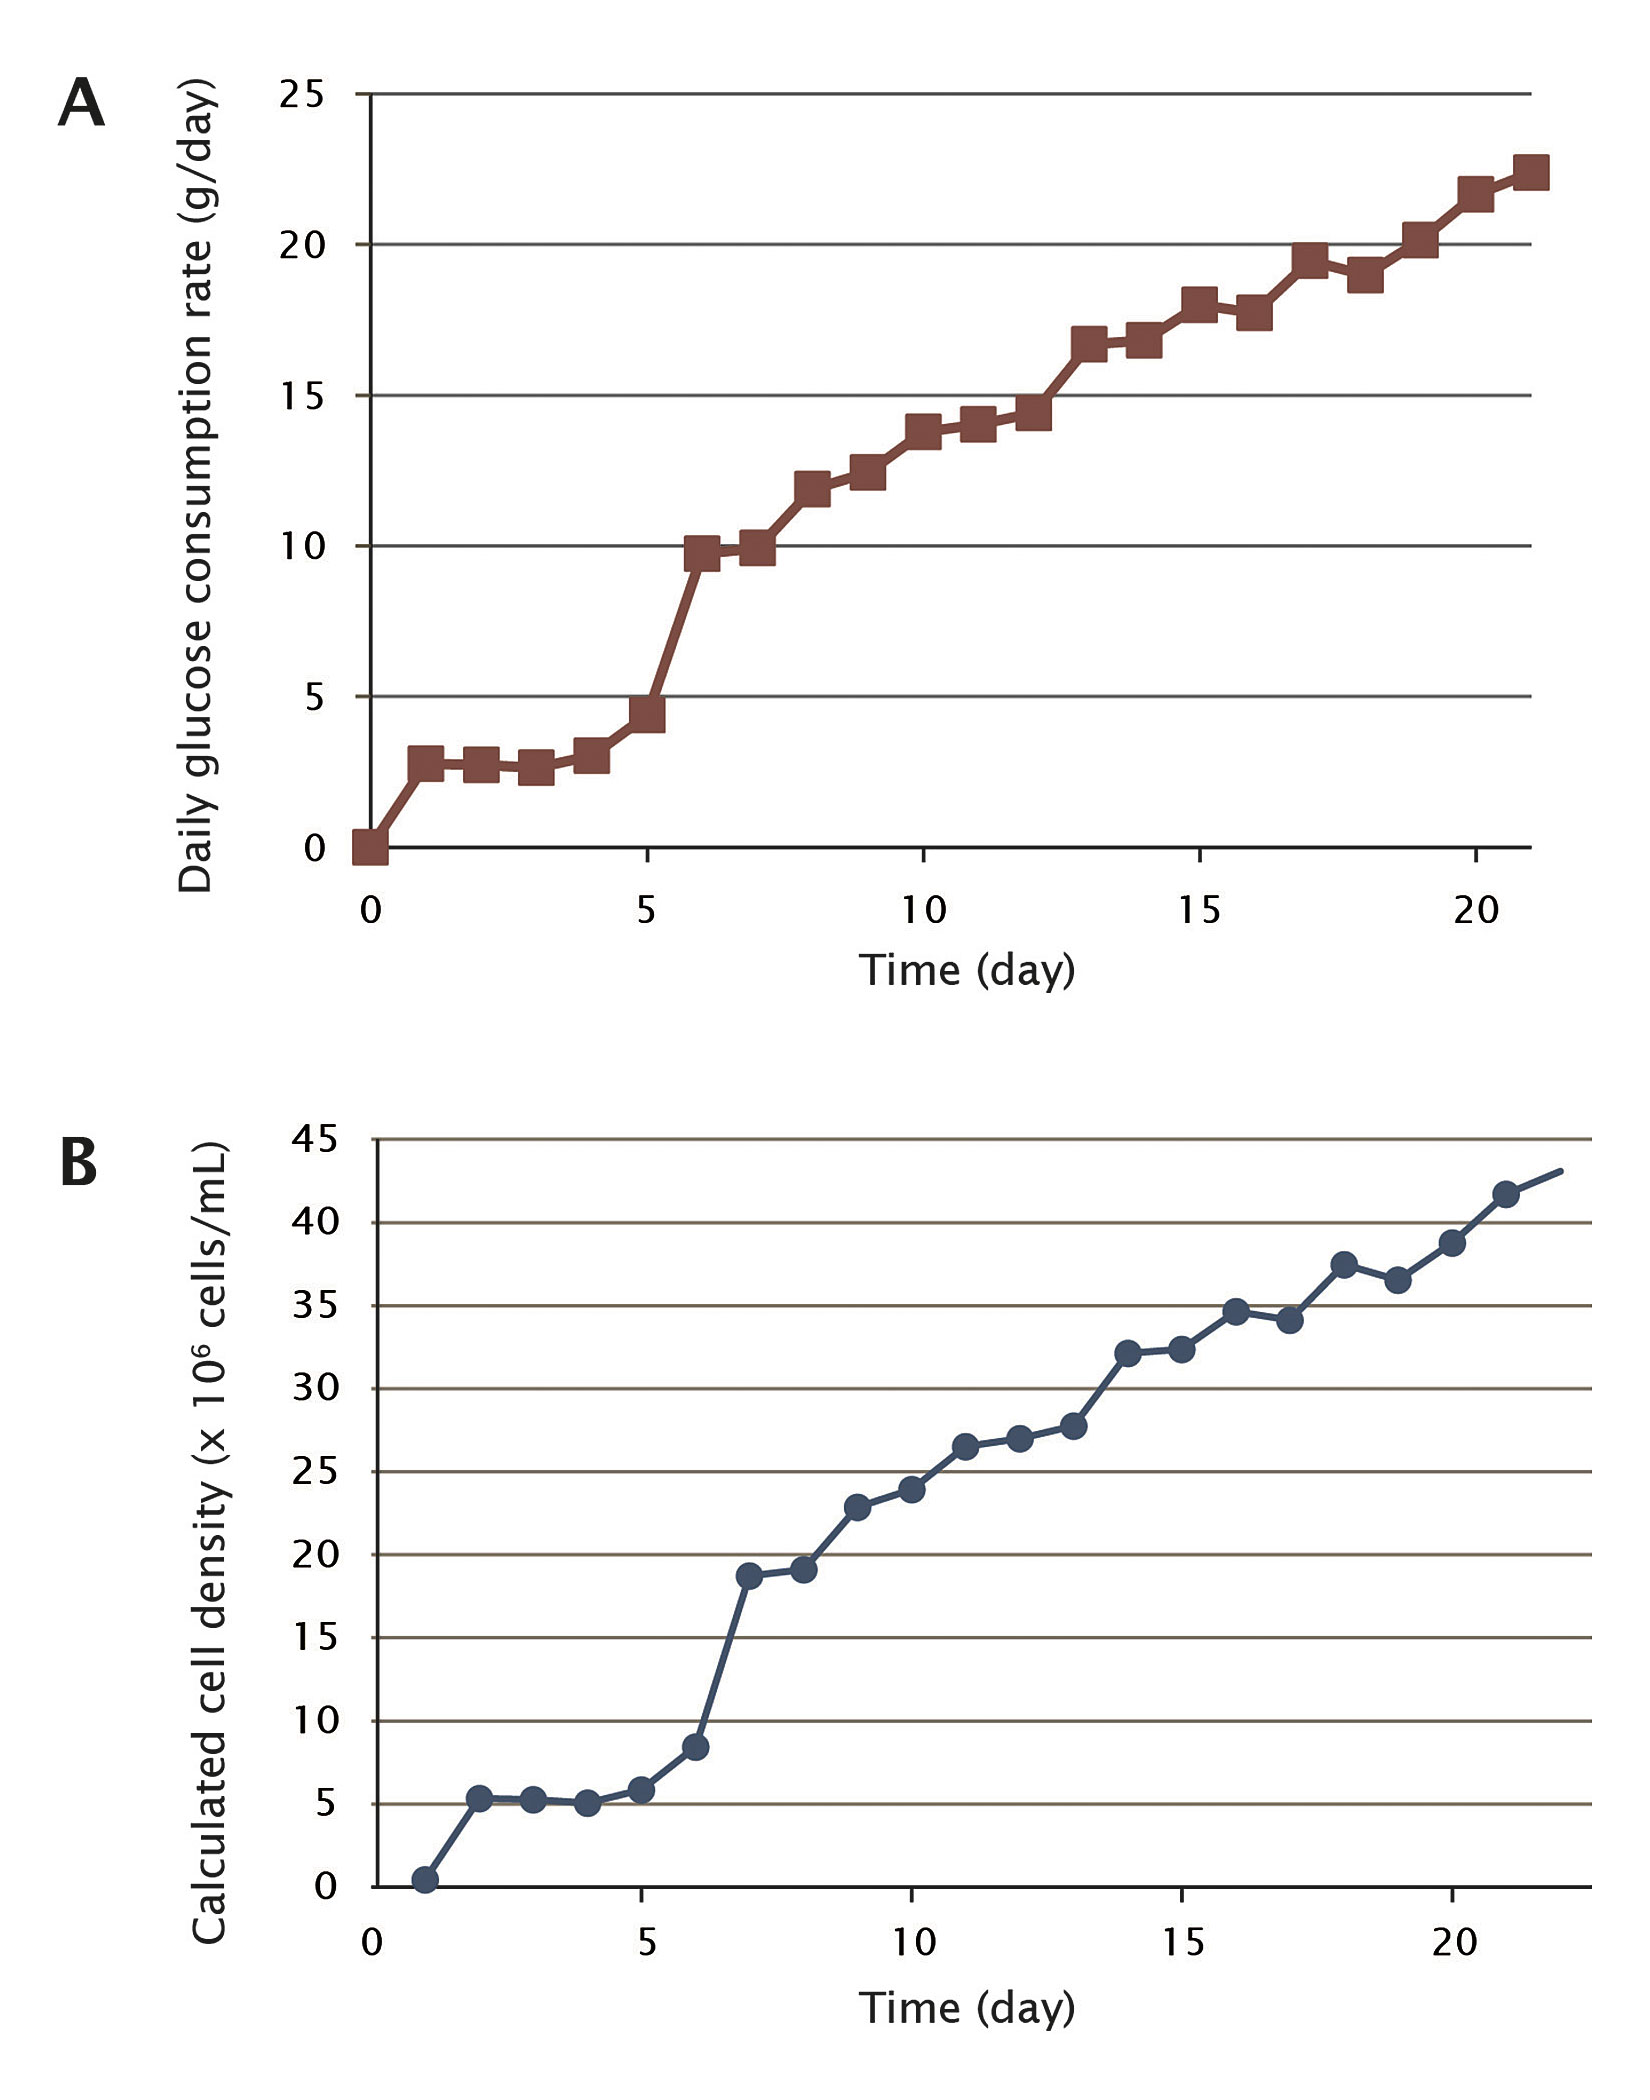
Figure 2. (A) Daily glucose consumption rate of the culture. (B) Calculated Vero cell growth curve.
Conclusion
We have demonstrated that the Eppendorf BioBLU 5p Single-Use Vessel prepacked with Fibra-Cel disks is an excellent platform for high-density Vero cell culture. In the 3.5-L vessel, we achieved a high Vero cell density of approximately 43 million cells/mL, demonstrating great potential for Vero cell–based vaccine production. Since viral particles are much smaller than cells, they can be directly eluted from packed-bed cell culture vessels without removal of cells. In addition, as high Vero cell densities can be translated into high virus production yield, that is, high titer, the Fibra-Cel packed-bed platform is ideal for high-titer viral vaccine production.
Xiaofeng (Kevin) Han, Ph.D., is senior research scientist, Ulrike Becken, Dr.rer.nat. ([email protected]), is scientific communication manager, and Ma Sha, Ph.D., is director of technical applications at Eppendorf.
1. Milián E, Kamen AA. Current and Emerging Cell Culture Manufacturing Technologies for Influenza Vaccines. Biomed. Res. Int. 2015; 504831. doi: 10.1155/2015/504831. [Epub 2015 Mar 1.]
2. Han K, Sha M. High-Density Vero Cell Perfusion Culture in BioBLU® 5p Single-Use Vessels. Eppendorf Application Note 359. October 2017.
Continuous Bioprocessing: Brave Old Challenges with Bold New Technologies
Visions of a Continuous Bioprocess Future
Continuous Processing’s Benefits within Biopharma’s Reach
Continuous Low-pH Virus Inactivation: Challenges and Practical Solutions
Single-Use Pressure Sensors for Continuous Processing and Leak Testing
A Swiss Army Knife for Modern Biomanufacturing
Next-Generation Processing a Multidisciplinary Pursuit
Next-Generation Bioprocess Techniques

