
Advancements in protein sample preparation workflows that increase sensitivity and are faster, cheaper, and better, as well as innovations in data collection and analysis, are moving mass spectrometry into clinical applications to identify and quantify proteins in complex biological samples.
Mass spectrometers comprise three major components: an ionization source, a mass analyzer, and a detector—which measure mass to charge (m/z) ratios of a sample’s components. A sample loaded into the instrument’s inlet is ionized and vaporized in the ionization source using heat, gas, and voltage. The mass analyzer, set at a lower pressure than the source, pulls the ionized molecules into it based on their m/z ratio.
Different types of mass analyzers can be used to quantify protein levels, proteoforms of host-cell contaminants, or target proteins. Types of mass analyzers include: time-of-flight, quadrupole, ion trap, magnetic sector, and electrostatic sector. A high-voltage current accelerates the ionized molecules onto the detector, where molecules of smaller mass strike the detector faster. Strikes are recorded over an allotted time period, converted to data, and compared with known calibrated standards to calculate mass and measure amplitude of individual sample peak(s).
One challenge of determining the full range of proteins in a sample is identifying the large dynamic range of proteins, especially those in low amounts. “Bottom-up proteomics provides the most complete coverage of a proteome in a sample, with a fine resolution down to single proteoform levels,” states Casimir Bamberger, Ph.D., research associate at the Scripps Research Institute, La Jolla, CA.
In bottom-up proteomics, proteins are enzymatically digested into peptides that can be detected, identified, and quantified with high efficiency. “But gains in efficiency come at a price,” Dr. Bamberger states. “When peptides are mapped back to proteins, ambiguities can arise because the same peptide sequence can be part of different proteins or proteoforms. While this ‘protein inference’ problem cannot be solved completely, it can be alleviated with increased proteome coverage.”
Even if a bottom-up proteomics experiment is repeated precisely on the same proteome, and the extent of proteomics coverage is similar, results can differ due to sample differences and measurements. “Proteins detected in the first experiment may not be detected in the second one, and vice versa. Usually, proteins in high abundance are identified in both samples, but low-abundance proteins and proteoforms can be under-sampled,” he states. Each experiment can yield a unique proteome assembly from peptides, making the data ambiguous.
To address two major potential error sources in an experimental setup—incomplete proteome coverage and random measurement errors in quantitation—scientists at Scripps Research Institute have developed a tool, ProteinClusterQuant, (PCQ), which preserves all peptide–protein relationships and accounts fully for random error measurements. PCQ uses a protein–peptide bipartite network that takes all redundant connections between proteins and peptides and compresses them into protein and peptide nodes. This protein–peptide bipartite network represents a proteome or sub-proteome, where nodes represent proteins and peptides, and edges reflect all connections of all peptides to all possible proteins and proteoforms. It is bipartite because one set of nodes is all peptides; the other set is all proteins. Edges can connect only a node of one protein set to a node of the peptide second set. In a protein–peptide network, an edge literally connects a peptide with a protein.
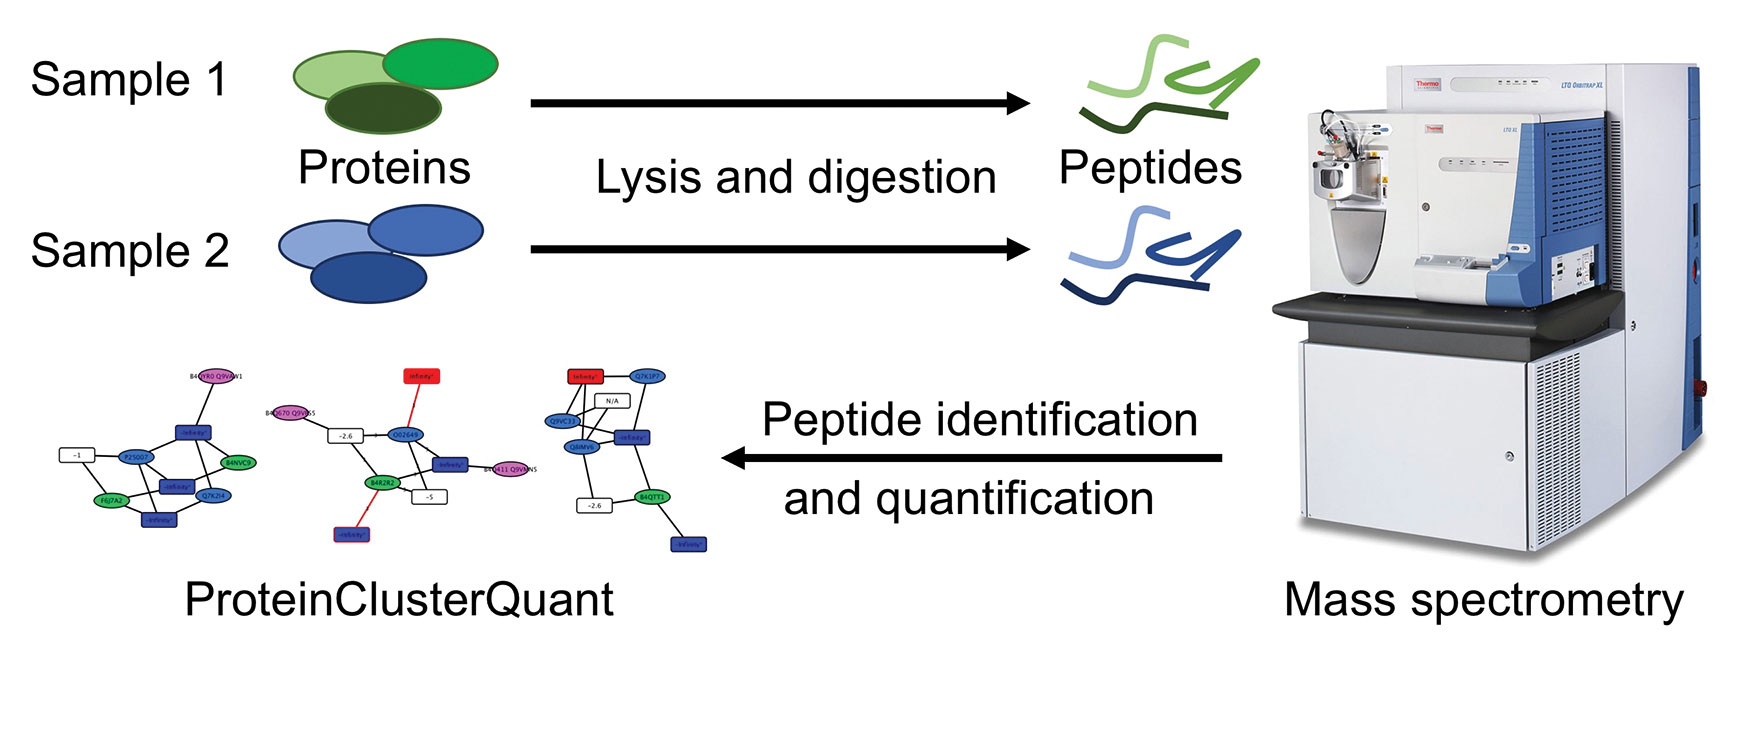
Comparing Protein Pairs
PCQ reduces the protein–peptide network by merging proteins that are connected to the same set of peptide nodes in a single protein node, and merges all peptides connected to the same set of proteins in a single peptide node. Final quantitative ratios in each peptide node result from aggregating the individual peptide spectrum match ratios of all peptides contained in the node by propagating the errors through the different levels.
PCQ extracts all protein pairs, compares the relative peptide abundances, and reports proteins pairs in which proteins or proteoforms are differentially expressed between two samples. “It allows us to look for protein pairs that miss one of the unique peptide nodes and where the two remaining peptide nodes show a significant difference in relative abundance. This is a strong indicator that a proteoform is present and significantly regulated, but was not detected in the experiment,” Dr. Bamberger states.
Scientists used PCQ to compare two isogenic cell lines that differ by only one mutation in the cystic fibrosis transmembrane conductance regulator (CFTR). A genetically inherited deletion of phenylalanine 508 in CFTR is responsible for most cases of cystic fibrosis. Data analysis using PCQ pinpointed differential expressions of peroxiredoxin 4 and peroxiredoxin 2, compared with the highly similar homologue peroxiredoxin 1. It also identified differential expression of the serine/threonine protein kinase PKN2 variant compared with PKN1 and PKN3.
Sciex scientists use the data-independent acquisition (DIA) strategy SWATH® (sequential window acquisition of all theoretical) acquisition on a Sciex QuadrupoleTOF® system to find low-level host-cell proteins (HCPs), including those previously unknown or nonimmunogenic in animal studies. To detect HCPs, the mass spec uses a wide Q1 isolation window across the entire detection range. This allows the full MS/MS spectra to be measured on every detectable analyte passing through each Q1 window.
SWATH is the only DIA strategy with variable window acquisition, meaning that the Q1 isolation window can be adjusted. For example, smaller Q1 m/z windows can be used in the densest m/z sample regions to increase specificity and reduce the risk of missing low-abundance peaks in complex samples.
“Individual protein identity information comes directly from the acquired data, rather than a number for the total sum of HCA [hydrophobic cluster analysis], which is a current limitation of ELISA-based methods,” states Kelli Jonakin, global marketing manager for pharma and CRO, Sciex. “The digital record that is created can be used as a digital archive of the current state of a sample. Any protein contaminant concerns that may emerge in the future can be tracked over time by mining the data retrospectively, without the need to have the actual sample saved for reanalysis,” she adds.
Samples are prepared by generating an HCP spectral library, and processing them in high-throughput using SWATH DIA. The HCP spectral library is generated by performing a comprehensive proteomic analysis of host-cell-conditioned medium. During profiling, fractionation strategies are used, such as size-based fractionation at the protein level or high-pH reversed-phase separation at the peptide level. Peptides and proteins are identified by database matching to the host-cell proteome using the ProteinPilot™ software, which generates the comprehensive MS/MS spectral library for SWATH analyses. This software uses an algorithm to match MS/MS data to a protein-sequence database and searches for modifications, genetic variants, or unexpected cleavages that may be present on the peptides, while avoiding a high rate of false positives. This ensures the resulting MS/MS spectral library is as complete as possible before the SWATH-based HCP screening analyses. In this case, the full HCP complement can be detected at sub-ppm levels in a single 1-hour liquid chromatography–mass spec (LC–MS) run.
“It’s well known that ELISA assays are limited by a lack of availability of antibodies with high specificity, and [that] developing high-quality, antibody-based assays are expensive, time-consuming, and resource-intensive. They also do not discriminate between proteoforms,” states Christoph Borchers, Ph.D., director, UVic Genome BC Proteomics Centre, University of Victoria.
To address this problem, scientists at the Proteomics Centre developed a post-immune-enrichment on-bead digestion (PIOD) assay that combines commonly available antibodies and immuno-matrix-assisted laser desorption/ionization (iMALDI) technology to develop a immunoprecipitation assay that can deliver extremely high assay sensitivity (8,000-fold increases) and specificity, while lowering the cost of preparing antibodies. With this methodology, limits of detection in some cases are at pg/mL levels.
Quantifying Proteins
In conventional Stable Isotope Standards and Capture by Anti-Peptide Antibodies (SISCAPA) and iMALDI technologies, proteins are denatured, digested, and captured with antipeptide antibodies. These peptides are analyzed with ESI or MALDI–MS. However, antipeptide antibodies are not always available for proteins. In a proof-of-concept PIOD assay optimized to detect AKT1 proteins, 10 ng of human AKT1 proteins—which are human cancer-related proteins—were spiked into 100 µL of E. coli cell lysate. Protein G-functionalized magnetic beads were coated with either antipeptide or antiprotein antibodies, incubated with sample solutions for enrichment, washed, and re-suspended in sodium deoxycholate for denaturing. Iodoacetamide and 1,4-dithiotreitol were added for protein reduction and alkylation. Trypsin was then added for on-bead protein digestion. Supernatant was removed. The beads were washed and transferred to a MALDI plate, and the matrix was spotted. The epitope-containing peptides were eluted and analyzed on MALDI–TOF.
After trypsin digestion, AKT1 proteins were detected in bead spots, but not the supernatant, showing stability of the antibody-peptide complex. The lowest level of detection was 1.1ng/mL from 50 µg of total proteins from cell or tissue lysate. “This workflow schema uses commonly available antibodies. One antibody is used, as opposed to two with ELISA, reducing time, cost, and complexity,” states Huyan Li, a postdoctoral fellow in the Proteomics Centre. Further, PIOD–iMALDI can be used to quantify other proteins in biofluids.
“One of the most challenging aspects of quantifying proteins from biological matrices is often the workflow complexity, and developing standardized bioanalytical methods that are sensitive, specific, and robust for a diversity of large molecules,” states Steven Calciano, product marketing manager at Waters.
Scientists at Waters have developed a workflow scheme to accurately quantify C-reactive protein (CRP) in endogenous human plasma in fewer than three hours, versus about 24 hours using conventional ligand-binding assays for quantification.
Synthesized in the liver and measured in blood plasma, elevated CRP levels in blood can indicate inflammation from tissue injury, potentially making it a biomarker for heart disease and stroke. Thus, measuring CRP quickly and accurately is vital. In developing this workflow scheme, scientists spiked human or rat plasma samples with 35 µL of human CRP. Spiked samples were enzymatically digested for about two hours using ProteinWorks, a commercially available kit and protocol with lot-traceable, premeasured reagents.
Post-digestion, samples were separated using ultra-high-performance liquid chromatography. Sample contaminants were removed via solid-phase extraction. A 5 µL sample amount was used for MS injection. For final quantification in human plasma samples, accuracy ranged 89.4–103.5%, with relative standard deviations of <5%, and linearity of four orders of magnitude.
“Advantages of LC–MS include: detecting multiple peptides or proteins in one run, sensitivity, specificity, wide dynamic range, fast method-development times, and often not requiring protein-specific antibodies for detection. In addition, LC–MS platforms are widely employed for standard, small-molecule bioanalysis,” said Calciano. As efforts continue to increase assay sensitivity and simplify workflow, Calciano sees LC–MS technology being applied in more industries. “While LC–MS remains a mainstay in pharmaceutical discovery and development, {the use of the technology in] additional markets like food-fraud testing and extractables and leachables testing are growing.”
Mary Addonizio is a Freelance Writer and Program Manager.


