Drug discovery project teams must make many decisions, from choosing the best target to selection of appropriate compounds in hit finding, hit-to-lead, lead optimization, and nomination of a preclinical candidate. Making good decisions at each stage is essential to the successful outcome of a drug discovery project.
Poor choice of target or compound can lead to wasted effort due to unnecessary synthesis and screening or, worse, late-stage failure after incurring high cost. Conversely, overaggressive filtering of pipelines can lead to missed opportunities to find new therapies.
Making good decisions in drug discovery is an enormous challenge. Early screening and theSept widespread use of predictive modeling have dramatically increased the amount of compound-related data that is available from the earliest stages of drug discovery. Optimization of a compound requires many properties to be balanced simultaneously. This is made even more difficult by the fact that all of the sources of data have significant uncertainty.
Human beings are notoriously poor at making decisions based on complex, uncertain data, particularly where there is a lot at stake. For this reason, decision-support software tools are often used to assist with the decision-making process. However, as this tutorial will discuss, they are not necessarily sufficient to deal with all of the challenges.
Software platforms such as Optibrium’s StarDrop™ go beyond visualization to guide decisions and help scientists to objectively assess all of the available data, focusing attention on a good set of options for detailed consideration.
Supporting Decisions
Decision-support tools include laboratory information management systems, databases, data-processing systems, and data-visualization packages. These collect, aggregate, and process data and, ultimately, provide engaging visualizations that help to analyze data and present findings to colleagues. Clearly, these are essential capabilities. But, are they sufficient to gain the most value from the data and drive effective decisions?
Common visualization approaches include data tables with “traffic lights” to indicate good, intermediate, or poor results (Figure 1A). But, this view is complicated when dealing with large numbers of properties and, if an ideal (all green) molecule is not present, it is difficult to select molecules visually; for example, is it better to have one red property value or three yellow?
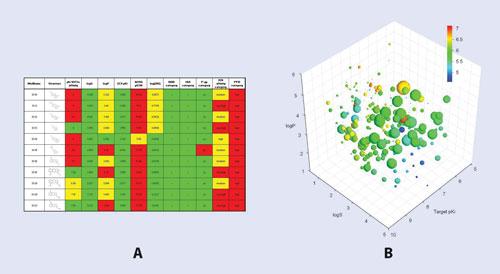
A multidimensional plot of the same dataset is shown in Figure 1B. While visually appealing, these plots rapidly become complex and difficult to interpret when dealing with many properties. It is difficult to quickly identify high-quality compounds that meet the success criteria across multiple properties and showing the uncertainties in the data (e.g., using error bars) quickly makes the plot unreadable.
When faced with such a complicated picture, judgments tend to be made by gut instinct. This makes a consistent, objective assessment of the data difficult to achieve and hence visualization is often, in practice, used to support a decision that has already been made, rather than to drive the decision-making process itself. Gut instinct can be a useful guide, but psychologists have identified unconscious biases in decision making to which humans are all subject.
In this context, the most relevant of these is “confirmation bias,” which is the human tendency to look for evidence that confirms rather than refutes initial judgment. Confirmation bias can lead to missed opportunities, as choices may be narrowed too quickly or, conversely, wasted effort as projects are failed too late.
Guiding Decisions
The process of guiding decisions, in contrast to supporting decisions, begins with a definition of the objectives of a project, defined as the property criteria that the project team would ideally like to achieve. Interactive software, such as StarDrop, can use this definition to proactively guide the decision maker to focus effort on the options, in this case compounds, which are most likely to achieve the required balance of properties.
A sample “scoring profile” shown in Figure 2, defines the properties of interest and the success criterion for each. In addition to the criteria, their relative importance to the success of the project is also defined, as in practice it is often necessary to make a trade-off between properties if an ideal molecule cannot be identified. The available data can then be combined into a single score that reflects the overall quality of a compound against this profile.
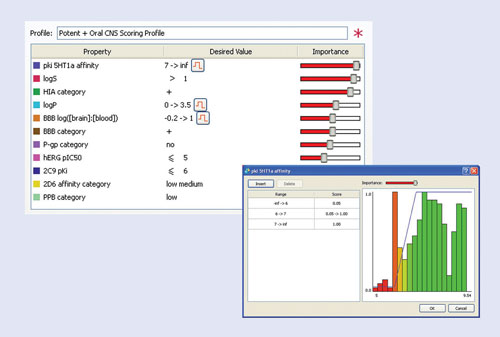
It is also essential to take into account the uncertainty in the underlying data. When all of the data is combined in a single score, scientists need to consider the resolution this provides to distinguish between compounds. To achieve this, an overall uncertainty in the score for each compound can be calculated.
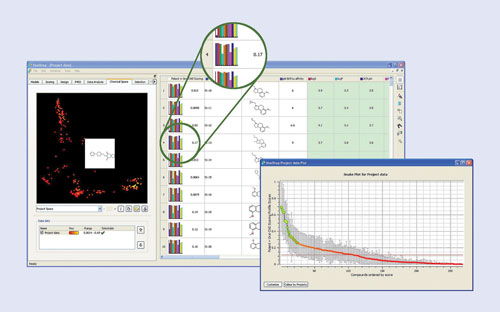
Of course, it is essential to support this analysis with visualizations that help scientists to identify patterns in their chemistry and identify compounds on which to focus their attention. One of these is shown in the graph in Figure 3, in which the scores for each compound are plotted, along with error bars that show the uncertainty in each score indicating the confidence with which compounds can be distinguished.
Plotting this information in a chemical space, which reflects the diversity of the chemistry being explored, allows hot spots to be quickly identified in which high-quality compounds are most likely to be found. Furthermore, the impact of each property on the individual compound scores can also be identified, taking into account not only the property value, but also its uncertainty and the importance of the property. This highlights which properties would have the largest impact on the overall quality of a compound if improved. Examples of these visualizations are shown in a screenshot of Optibrium’s StarDrop software (Figure 3).
Conclusion
Tools to aid the decision-making process should not be black boxes. Users must be able to interact with the analysis, challenging the decision-making process, and investigate the trade-offs in their compounds, guided throughout by an objective view of the data relative to their goals. Furthermore, this interaction must be accessible and intuitive to encourage creative exploration.
In order to improve the efficiency and productivity of drug discovery, however, it is crucial to go beyond gathering and visualizing data to maximize its impact on good decision making. Software that guides decisions, such as StarDrop, provides a rigorous approach that encourages objective consideration of all of the available information, helping scientists to overcome human cognitive biases to make decisions that are both balanced and rational. This, in turn, helps drug discovery scientists to quickly and confidently target areas of chemistry likely to yield compounds with a good balance of properties and a high chance of downstream success.
Matthew Segall ([email protected]) is CEO, and Edmund Champness is CSO at Optibrium. Web: www.optibrium.com.


