
April 1, 2016 (Vol. 36, No. 7)
Christopher Kistler Associate Principal Scientist Merck Research Laboratories
Jennifer Pollard Merck Research Laboratories
Lee Sin Ng Scientist Merck
Mathieu Streefland Ph.D. Associate Principal Scientist Merck
Utilizing the Ambr250 Automated Bioreactor System to Optimize Bioprocesses
High-throughput scale-down methods have become a critical component in process development. These strategies allow for screening a wide process design space while minimizing resources and material requirements. This ensures a better process understanding and more optimal conditions through the ability to enable high-powered design of experiment (DOE) approaches.
The fully automated Ambr250 system allows for minimal operator input and well-controlled experiments. The online measurements and remote monitoring provide additional data and the ability to intervene if necessary.
High-throughput technologies have become a routine part of the cell culture process development toolbox due to benefits such as a reduction in overall cost, a decrease in developmental timelines, and an increase in experimental efficiency.1
The Ambr 250 system is shown in Figure 1 and consists of 24 independently operated bioreactors with a maximum working volume of 250 mL, inside a HEPA-filtered enclosure. The platform allows for four “addition” lines to each of the bioreactors linked to fully independent feed pumps. This setup enables control of complex feeding strategies. Automated sampling and small volume additions are available via the liquid handling arm.
There is temperature-controlled sample storage on the deck, with a range of −20°C to ambient temperature. The Ambr250 system has been used for process and medium development for both cell culture and microbial processes. Performance at the 250 mL scale is comparable to performance at development, pilot, or commercial scales.2
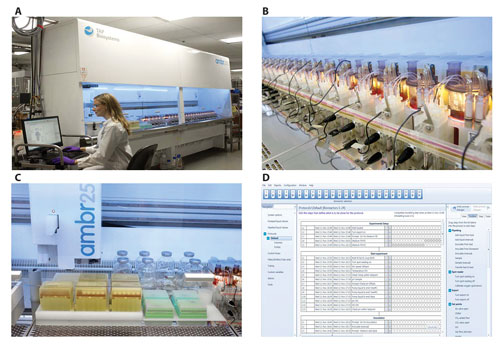
Figure 1. (A) The full Ambr250 system, which includes 24 independently operated bioreactors. This configuration’s dimensions are 2.42 m (H) × 1.15 m (D) × 4 m (W), not including the computer workstation. (B) A close-up view of part of the bioreactor vessel block. The sampling cap for the pipet arm, the nutrient feed lines, incoming and outgoing gas filters, as well as the connection point to the pump manifold can be seen. (C) The liquid-handling area with pipet tips (300 µL and 10 mL) in front, the liquid handling arm on top, and liquid source bottles in the back. (D) A representation of the operating software, which features a graphical drag-and-drop programming interface.
Process Development Case Study: Cell Culture Performance
As a part of the development of an upstream cell culture process, the Ambr250 automated bioreactor system from TAP Biosystems (a part of the Sartorius Stedim Biotech Group) was used to evaluate the impact of impeller power input on cell culture performance.
Of the 24 bioreactors on the system deck, 10 were dedicated to the experiment, which evaluated different power inputs. These ranged from a fivefold decrease to a twofold increase with respect to the standard process.
The results from the Ambr250 were then compared to those from the standard process, which was run in 3 L glass bioreactors. Such bioreactors are customary in process development.
A key consideration in the investment in high-throughput cell culture technology is building the data to ensure bioreactor-to-bioreactor comparability. Importantly, the viable cell density, measured by trypan blue exclusion, was highly consistent between the five Ambr250 bioreactor replicates running the standard process (Figure 2A). Building on this, there were no discernable differences between the viable cell density profile from the standard process and the process with increased power input.
Both of these processes also compared quite well to the standard process run in 3 L glass bioreactors. Interestingly, the process with low power input showed good comparability to the standard process early, but was not able to support the cell density beyond day 11 (Figure 2B).
The nutrient feed consumption profile is an important variable to monitor and control during cell culture process development.For this process, glucose concentration was monitored using an offline analyzer, and bioreactor samples were taken by the Ambr250 automated pipet arm. Nutrients were added to the culture by bolus addition of feed solution through the Ambr250 onboard pumps and subsurface addition lines.
The glucose level for each of the different processes was similar prior to day 11 (Figure 2C); at this point, the glucose consumption of the low power input conditions decreased due to the drop in culture viability.
With the Ambr250, it was shown that running at a power input lower than the standard process had a negative impact on the cell culture performance. This is likely due to impairment of mixing, nutrient delivery, or increased bubble shear due to lower oxygen transfer. These factors, in isolation or in combination, could be the subject of future experimentation on the Ambr250 platform.
Additionally, it was shown that there are no negative impacts to the cell culture process by running at higher power input, suggesting that the cultures are not sensitive to additional agitation-based shear. Finally, the culture environment generated in the Ambr250 was shown to be comparable to that generated in the 3 L glass bioreactors.
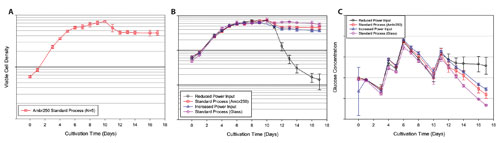
Figure 2. CHO cell culture in Ambr250: Impact of impeller power input. (A) Viable cell density for the five standard process replicates run in the Ambr250. (B) Comparison of viable cell density between the reduced power input condition (black circle, N = 2), standard process run in the Ambr250 (red square, N = 5), increased power input condition (blue triangle, N = 3), and the standard process run in 3 L glass bioreactors (purple diamond, N = 4). (C) Glucose profile as a function of culture time. In all cases, error bars represent one standard deviation.
Process Development Case Study: Product Titer and Quality
Advanced analytics are an important part of evaluating both individual clones as well as cell culture processes. A drawback of most high-throughput cell culture systems is the inability to support advanced product analytics due to low culture volumes. The Ambr250 system supports working volumes ranging from 100 mL to 250 mL of culture, which is sufficient to permit a regular measurement of product titer as well as product quality attributes.
In this example, product titer was measured at the point of harvest. As with the cell culture data, the product titer of the Ambr250 standard process replicates was very consistent. The product titer trends mimic those of the cell culture data in that the standard process and high power input perform similarly and demonstrate a higher product titer than the low power input conditions (Figure 3A).
In addition to product titer, an understanding of product quality attributes as a function of the process or cell line is highly advantageous information to obtain during process development. To measure relevant product quality attributes, a sample was taken from the Ambr250 bioreactors at harvest.
The data resulting from the product quality analysis was normalized to the data obtained from the 3 L glass control bioreactors. Again, there was good reproducibility between Ambr250 replicates and good agreement between the standard process run in both the Ambr250 and the 3 L glass bioreactors.
Impeller power input did not appear to drastically impact the product quality profile, as only Attribute 1 was significantly different from both the standard process as well as the increased power input conditions. Attribute 2 was only slightly increased compared to the standard process and increased power input process (Figure 3B).
The high-throughput, automated, and fully parallel nature of the Ambr250 system is a key enabler of “right first time” development in the upstream space through the support of complex process and medium screening designs that probe interactions. Conducting such development in larger vessels requires significant trade-offs. For example, designs could be done in blocks, but that could increase variability, or large numbers of bioreactors could be used, but that could be unrealistic from a resource viewpoint.
Additionally, as presented in this example, scaling and physical bioreactor parameters could be evaluated in the system, making it a complete tool for cell culture process development.
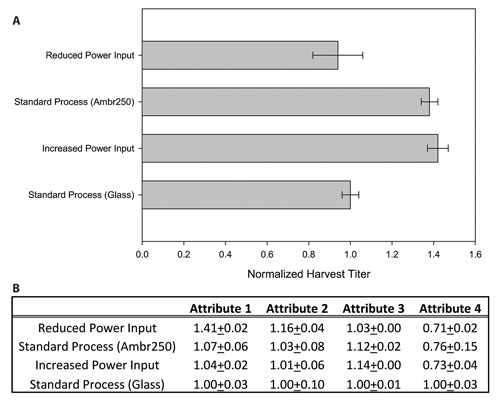
Figure 3. CHO cell culture in Ambr250: Impact of impeller power input. (A) Harvest titers for different power input conditions. Data has been normalized to the standard process condition run in the glass bioreactors. (B) Comparison of product quality attributes.The values have been normalized to those obtained from the standard process run in glass bioreactors. In each case, error bars represent one standard deviation.
References
1. Bareither R, Bargh N, Oakeshott R, Watts K, Pollard D. 2013. Automated Disposable Small Scale Reactor for High Throughput Bioprocess Development: A proof of Concept Study. Biotechnol Bioeng 110(12): 3126-3138.
2. Bareither R, Goldfeld M, Kistler C., Tait A, Bargh N, Oakeshott R, O’Neill K, Hoshan L, Pollard D. 2015. Automated Disposable Small-scale Bioreactor for High-throughput Process Development: Implementation of the 24 Bioreactor Array. Pharm Bioprocess 3(3): 185-197.
Christopher Kistler ([email protected]) is associate principal scientist and Jennifer Pollard serves as senior principal scientist in bioprocess development at Merck Research Laboratories in Kenilworth, NJ. Lee Sin Ng is a scientist and Mathieu Streefland, Ph.D., is an associate principal scientist in the Merck manufacturing division in Oss, the Netherlands.


