
December 1, 2016 (Vol. 36, No. 21)
Single-cell approaches to deciphering disease began in the era of antibodies, with technologies such as confocal microscopy and flow cytometry.
In the era of genomics, advanced approaches are examining single cells at a level of scrutiny never before achieved.
Using RNA sequencing (RNA-Seq) and RNA fluorescent in situ hybridization (RNA-FISH), scientists gain not only the ability to assess transcriptional variations in single cells, but also the ability to relate these variations to disease processes. Eventually, scientists will be able to determine where transcriptionally distinct, disease-associated cells are located in the cellular microenvironment.
Single-cell genomic approaches such as RNA-Seq and RNA-FISH preserve distinctions that older genomic approaches tend to blur, obscuring mechanisms and relationships behind disease. Before single-cell capabilities came to genomics, scientists who wanted to deepen their understanding of disease were limited to leveraging genetics. They compared the frequencies of genetic variants in patients to those of genetic variants in healthy individuals, and they assessed the average gene-expression signature of markers found more abundantly in a population of cells or in tissue derived from patients to infer biology driving disease.
When scientists attempt to leverage genetics in this way, they are essentially taking the “average of the averages,” says Alexandra-Chloe Villani, Ph.D., a postdoctoral fellow at the Broad Institute of MIT and Harvard. According to Dr. Villani, this approach has not been sufficiently informative to empower precision medicine.
“Sometimes diseases are driven by cells that are not very abundant but are very potent,” she points out. After spending 10 years studying autoimmune disease susceptibility, Dr. Villani has shifted her focus toward using single-cell genomics technologies to ask which immune components are driving pathogenic processes.
Smooth Transitions
“Just a few years ago,” states Dr. Villani, “people were blending different cell populations together like a fruit smoothie to get genomics information out of it and infer biology driving disease.” Refinement of cell-isolation methods now allow for separation of specific total cell populations, such as all T-cells, monocytes, natural killer cells, or other immune cell components. Genomic profiling of this refinement is more informative.
“Instead of a fruit smoothie, we’re dealing with a berry smoothie,” Dr. Villani avers. “Such an approach is already an improvement, but we’re not there just yet in terms of using the right strategies to precisely identify the ‘guilty’ cells driving diseases, the cells that should, ultimately, be therapeutically targeted.”
As recently as a decade ago, according to Dr. Villani, evidence emerged that immunological data (the type, density, and location of immune cells within the tumor samples), such as the location of the certain subtypes of T-cells in the tumor bed (for example, “on the margin” versus “in the center”), were a better predictor of patient survival than the histopathological methods commonly used to stage colorectal cancer. Scientists and physicians were becoming aware that single-cell variations might have a larger impact on disease than had been previously thought.
With single-cell approaches such as RNA-Seq, it is possible to “get samples from a Crohns’ disease or cancer patient,” says Dr. Villani, “and try to understand the different population of cells in it to infer some biology responsible for the disease.” This often begins with cellular isolation techniques, such as flow cytometry and cell sorting, to isolate, for example, all CD45-positive immune cells from the total population.
“The problem is that we have to create a suspension of cells from the tissue,” she cautions. “By doing so we are losing the spatial information, which is pretty important.”
Despite this limitation, single-cell analysis is versatile. Single-cell analysis, Dr. Villani explains, is capable of more than just surveying the transcriptome. It may incorporate: single-cell protein analysis (which has been part of flow cytometry for a long time), DNA sequencing (which has been used, for example, to investigate clonal evolution in primary tumors and the evolution of resistance to therapy), and epigenomic methods (which have been used to study gene regulation).
Different single-cell methods may be combined, allowing analyses of epigenetic-transcriptional correlations and enabling detailed investigations of how epigenetic states are associated with cellular phenotypes. Ultimately, integrated approaches have the potential to transform our understanding of how the phenotype of the cell is maintained and how it is perturbed in disease.
Excitingly, there are also converging technologies focused on sequencing in the context of spatial resolution, such as RNA-FISH, and next-generation technologies, such as multiplexed error-robust FISH (MERFISH) and fluorescent in situ sequencing (FISSEQ).
“There are now dozens of methods available,” Dr. Villani concludes, “depending on the questions you’re asking.” She notes that many of these approaches emerged in just the past 10 years. And she maintains that by combining these approaches, single-cell genomics may be best positioned to decipher mechanisms underpinning disease.

“Currently we don’t know, for example, which cancer cell is communicating with which immune cell,” she complains, blaming our inability to retain the necessary spatial information. “But thanks to these new multidimensional methods, we’re now definitely working toward getting there. That’s the whole idea behind empowering future precision medicine.”
Single-Cell Microwell
Jinzhou Yuan, Ph.D., is a postdoctoral research scientist in the laboratory of Peter Sims, Ph.D., assistant professor of systems biology at Columbia University. Dr. Yuan’s role has been to help the Sims laboratory develop a microwell assay for isolating cells for single-cell analysis of messenger RNA. “In the case of single-cell mRNA-Seq,” Dr. Yuan explains, “the physical isolation provided by oil-sealed microwells ensures that mRNA of cells in one well can be captured only by primers that are located in the same well.”
Dr. Yuan joined the Sims laboratory a little over a year ago, after studying at the University of Pennsylvania. Interestingly, his formal training was not in genomic analysis but in mechanical engineering, where he first developed microwell/microfluidic-based high-throughput technology to sort and monitor the behavior of individual nematode worms of the species Caenorhabditis elegans.
Although Dr. Yuan developed his technology for the study of locomotion, it had practical applications for examinations of single cells. “Because microwells have small volumes and are easy to fabricate in massive quantities,” Dr. Yuan explains, “microwell technology significantly lowers the per-cell reagent cost and increases the number of individual cells that can be processed simultaneously.”
In the Sims laboratory, Dr. Yuan studies human patient-derived tumor cell lines as well as cells dissociated from human brain tumor resections. This work contributes to our understanding how the tumor microenvironment affects tumor cell phenotype and evolution. A current study is focused on examining the intratumoral heterogeneity in glioblastomas.
“Single-cell RNA-seq provides a comprehensive view of the transcriptomic profile of [an] individual cell,” says Dr. Yuan, “I believe the microwell-based single cell mRNA-seq technology could help improve accuracy of diagnosis and assessment of effectiveness of many therapeutic procedures.”
T-Cell Receptors and the Human Cell Atlas
Like other investigative teams in the field, the group led by Sarah Teichmann, Ph.D., at the Wellcome Trust Sanger Institute, starts its sequencing experiments by separating single cells into reaction chambers, often wells within a microwell plate. “The captured cells are lysed,” explains Mike Stubbington, Ph.D., a senior scientist in the group, “and a reverse transcription reaction makes complementary DNA (cDNA) from their messenger RNA.”
The cDNA is amplified, and sequence libraries from many cells are pooled together and sequenced using an Illumina device. These tasks are followed by data analysis, which is Dr. Stubbinton’s focus. Sequence reads are de-multiplexed and assigned to the correct cell. From there, biological knowledge is extracted.
Dr. Stubbington inspects antigen receptor repertoires and lymphocyte single-cell transcriptomes. In much of his work, he relies on TraCeR, a software tool that he developed with Dr. Teichmann and other colleagues. TraCeR reconstructs the recombined T-cell receptor (TCR) sequences that are present within single-cell RNA-seq data.
TraCeR allows the Teichmann group’s researchers to do two things. “First, we can find the sequence of both chains that constitute the TCR,” explains Dr. Stubbington, who notes that this kind of information could be used to characterize the TCR’s target antigen. “Second, we can track family relationships between T-cells,” provided the TCR DNA shared sequences result from a shared progenitor cell.
Dr. Stubbington suggests that an understanding of heterogeneous lymphocyte populations could be very important in the study of autoimmunity, cancer, and infectious disease. “One could study the response of antigen-specific cells during vaccine trials or analyze the populations of T-cells that are present within a tumor microenvironment and how they change during immunotherapy.”
Last October, researchers at the Welcome Trust Sanger Institute and the Broad Institute convened a meeting of top scientists in the field to work on a global initiative called the Human Cell Atlas. Dr. Stubbington, who will lead the group associated with this effort at the Sanger Institute, sees this as an exciting application of single-cell sequencing technology.
“This project brings together an international consortium with the aim of producing a collection of reference maps of all cell types within the human body.” For example, one of the project’s early goals is to complete a survey of human immune system components at an extremely high level of resolution. Such a survey “would include information on their transcriptomic states,” details Dr. Stubbington, “as well as locations within tissues and within the body.”
RNA-FISH
Single-cell transcriptomes are only one way to analyze cellular heterogeneity. “You can have cells that are seemingly identical, but one of them may produce a whole lot of one gene and the other one may not,” proposes Arjun Raj, Ph.D., an assistant professor in the department of bioengineering at the University of Pennsylvania. His work focuses on the difference between one cell and the next, and the tool primarily used in his laboratory is RNA-FISH.
“It allows us to actually count the RNA molecules by imaging in individual cells,” says Dr. Raj. “The game is to try to figure out whether the differences we find matter, or whether we can determine the causes of these differences.”
RNA-FISH, which allows for visualization of individual RNA molecules in a fixed cell, provides different results from RNA-Seq. “Single-cell RNA-Seq is basically doing RNA sequencing on individual cells, allowing you to measure the transcriptomes.” RNA FISH, he continues, “allows us to look at a somewhat limited pool of genes,” often as few as 10 or 20, depending on the fluorescent tags available, “but with very high resolution.” It can also provide gene localization and copy number data on this limited set of genes.
Unlike RNA-Seq, RNA-FISH requires that the gene sequence be known, so that an oligonucleotide can be produced or purchased commercially. However, Dr. Raj sees this technology as being useful in the near future for assessing the role of drugs on gene-expression patterns.
Dr. Raj, who was one of the first to establish RNA-FISH imaging, is primarily focused on applications of the technology; but he is aware that others are expanding the technology’s limits: “There is RNA-FISH right now that can measure 1,000 genes at a time from a very large number of cells, which is pretty amazing.” But for now, single-cell RNA-Seq is massively multiplexed, and single-cell RNA FISH is far more accurate.
“Sequencing technology is getting more accurate, and imaging approaches are getting more and more multiplexed,” he observes. “I think those approaches are converging on some level.”
A 3D Environment for Cells, Thanks to Spheroid Microplates
Although in vitro 3D cell culture models are widely recognized as more physiologically relevant systems than 2D formats, the adoption of 3D cell culture models in high-throughput screening (HTS) platforms has been slow.
3D models more accurately reflect the complex in vivo microenvironment, and they have been used in many research areas, such as cancer biology, hepatotoxicity, neurology, pancreatic studies, nephrology, and stem cell biology. But the available technologies for producing 3D models have their limitations, including increased variability, low throughput, difficulty with automation, and high cost.
“Corning wanted to develop a solution for consistently growing 3D cell culture spheroids in a manner compatible with HTS platforms,” says Hilary Sherman, an applications scientist at Corning Life Sciences. Corning’s solution: spheroid microplates, cell culture plates that have multiple, round-bottomed wells. The bottom of each well is clear and the walls are opaque. The ultra-low attachment surface coating, which is hydrophilic, biologically inert, and nondegradable, is covalently attached to the interior surface of the well bottom.
“With the unique design of the well bottom, the spheroid microplate is able to reproducibly grow 3D cell spheroids in which there is a single sphere produced and centered in each well,” explains Sherman.
The plate’s opaque side walls and gridded plate bottom were designed to reduce well-to-well cross-talk and background fluorescence/luminescence, while the clear bottom allows for imaging. Therefore, spheroids of desired size may be generated, cultured, and assayed for fluorescent or luminescent signals in the same plate without the need for transferring the spheroids, according to Sherman, who adds that the plates are automation-friendly, enabling high-throughput applications with 3D cell culture models. Currently, Corning spheroid microplates are available in both 96-well and 384-well formats.
Using Multiple Platforms to Generate Single-Cell Insights
Complex biological systems are fundamentally determined by the coordinated functions of individual cells. The transcriptional heterogeneity that drives this complexity is often masked by conventional technologies that provide only bulk transcriptome data.
Cellular heterogeneity can be captured, however, if a single-cell solution developed by Illumina and Bio-Rad Laboratories is used. With this solution, single cells are individually partitioned into subnanoliter droplets on a disposable cartridge. The cartridge can accommodate multiple samples, and multiple cartridges can be processed in parallel to quickly isolate hundreds to tens of thousands of cells. Cell lysis and cell barcoding occurs inside individual droplets, and single-cell-barcoded RNA-Seq libraries are subsequently prepared using Nextera® Technology.
This droplet-based method is agnostic to mammalian cell size, and the sensitive assay chemistry delivers unbiased profiling of diverse and heterogeneous cell populations. Powerful yet simple data analysis is enabled by BaseSpace®, a cloud-based genomics platform from Illumina, and SeqGeq™ (SEEK-GEEK), an application for data analysis, exploration, and visualization developed by Illumina and FlowJo.
SeqGeq can enable bench scientists to extract insight from the individuality of single-cell gene expression. Built by biologists with 19+ years of experience with single-cell biology, SeqGeq has powerful data reduction and population identification tools and a workspace to track populations and gene tables. It provides an application for visual navigation and analysis of gene expression data across gene families. An example of this approach using BaseSpace and SeqGeq is shown in the figure.
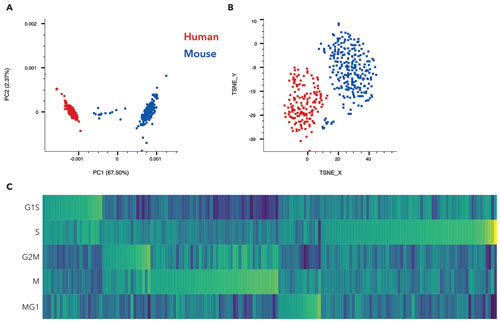
Figure. (A) PCA analysis of 1,384 cells from a 1:1 ratio mixture of HEK293 and NIH3T3 cells. (B) A mixture of mouse cells spiked with human cells. The human cells (representing 7% of the total cell population) are identified as a distinct cluster in t-SNE analysis based on gene-expression profile. Cells are color-coded by gene expression of human RPL13 gene (red) or mouse RPL13 (blue) to confirm the identity of the subpopulation. (C) Single-cell heatmap shows cell-cycle state based on unique transcript counts of genes, normalized by total count for each cell for a mixture of HEK293 and NIH3T3 cell lines. Expression is centered by the median and scaled by the median absolute deviation for each cell cycle.
Ian Clift Ph.D. is a Scientific Communications Consultant, Biomedical Associates and Clinical Assistant Professor, Indiana University


