
November 15, 2007 (Vol. 27, No. 20)
Sigrid Kuebler
Detecting and Quantifying Aggregation Using Dynamic Light Scattering
Formulation development is one of the critical steps in advancing a protein or a peptide as a therapeutic product. The challenge is to maintain the integrity of the complex and the often highly sensitive 3-D structure of biopharmaceutical drug substances by designing an ideal environment of stabilizers, buffers, and detergents.
The formulation must be resistant both to physical and chemical degradation. Typical stability problems observed in protein dosage forms are covalent and noncovalent aggregations, deamidation, cleavages, oxidation, and surface denaturation, all of which may cause the protein therapeutic to lose biological activity. During formulation development, the effects of various formulation excipients such as surfactants, sugars, salts, antioxidants, and amino acids are screened to optimize protein stability.
Size exclusion chromatography (SEC) is a routine method for detecting and quantifying protein aggregation and is often coupled with a static-light-scattering (SLS) detector. A major disadvantage of SEC is the potential loss of aggregates through filtering or binding to the column.
Therefore, column-free analytical methods such as field-flow fractionation (FFF), analytical ultracentrifugation (AUC), and dynamic light scattering (DLS) are now increasingly used for aggregation analysis. DLS offers the advantage of being a rapid measurement when compared to the other techniques. Additionally, DLS is nonperturbing and nondiluting, thus preventing potential dissociation of reversible aggregates.
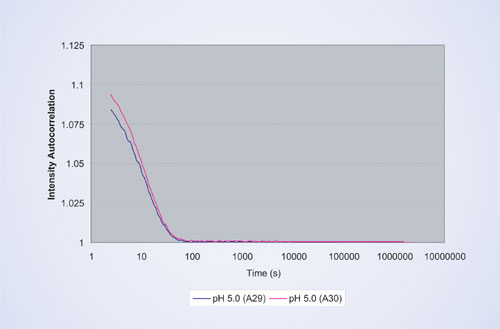
Figure 1
Light-scattering Technology
Two types of light-scattering measurements exist to characterize macromolecules: SLS and DLS. SLS detectors and especially multiangle light scattering detectors measure the time average intensity of light scattered from the macromolecules in solution.
The intensity of scattered light is proportional to concentration and absolute molecular weight (Mw) of the molecules. SLS measurements can be carried out in two modes. Stand-alone, also known as batch mode, avoids the need for size separation and yield the average Mw of the molecules. Alternatively, measurements can be made in online mode, which requires an SEC system to determine molecular weight and Mw distribution. Concentration is often determined online with a UV or refractive index detector. Such measurements are independent of the shape of the macromolecules.
For larger molecules with a radius exceeding 10 nm, typically much larger than a protein monomer, the angular dependence of the SLS can also be used to determine their size. This technique can also be used to determine the second virial coefficient, A2, which describes the interaction between the molecules and the solution and can also be used to screen the crystallization behavior of biological macromolecules in solution.
Dynamic light scattering detectors measure the time-dependent fluctuations of the intensity of scattered light in the order of 100 ns to 100 ms, which arise from the molecules undergoing Brownian motion (translational diffusion). Larger molecules move more slowly than smaller ones, and thus the time scale of the light intensity fluctuations can be related to the molecular size. The larger the protein, the slower it diffuses, which results in a slower decay of the autocorrelation function.
The parameter measured by DLS is the hydrodynamic radius, which is defined as the radius of a spherical particle with the same diffusion coefficient as the macromolecule of interest. Since the intensity of the scattered light is proportional to molecular weight, light-scattering methods are highly sensitive for detecting small amounts of large aggregates.
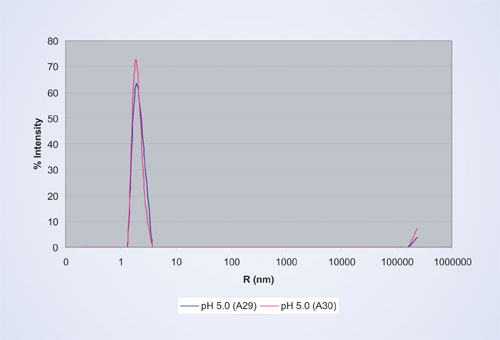
Figure 2
Experimental
Using a DLS Plate Reader from Wyatt Technology (www.wyatt.com), a therapeutic peptide from two different preparations was screened for aggregation behavior in different buffer formulations. The samples were dissolved in 10 µL of buffers at protein concentrations of approximately 1 mg/mL. Samples were transferred to a 1,536-well plate and measured at room temperature.
The instrument is compatible with industry-standard 96-, 384-, and 1,536-format well plates with a minimum sample volume as low as 4 µL per well. The 1,536-well plate was chosen to minimize the sample amount needed for each formulation and enable the screening of a wide range of formulation conditions. The total measurement time per well was 100 seconds.
Five different formulation conditions, ranging from pH 5 to pH 8, were explored for each protein preparation. To assess reproducibility, two wells were measured for each sample. Figure 1 shows a typical autocorrelation function for the therapeutic protein prepared by method B in sodium acetate buffer at pH 5.
Figure 2 shows the corresponding size distribution by scattered light intensity calculated by the built-in regularization algorithm, which results in an average hydrodynamic radius (Rh) of 2.0 nm and a size distribution (% polydispersity) of 14%.
For globular proteins, the relationship of Rh and Mw is well known, which results in an estimated Mw of 17 kDa of the protein above. This is slightly larger than the molecular weight of 12 kDa measured by SEC, indicating the predominance of monomers with a small fraction of oligomers in this particular protein formulation.
A comparison of the particle sizes in different buffer conditions for protein formulation A is shown in Figure 3. The formulation shows the least amount of aggregates in the size range >10 nm and is thus the most stable in buffers ranging from pH 6 to pH 7.
The peaks at the smallest radii in the range of 0.1–0.5 that are often visible for low concentration samples are caused by the presence of buffer salts and are not taken into account for the analysis. The protein monomer and its oligomers possess a hydrodynamic radius of approximately 2 nm. This peak is the predominant peak in all formulation conditions. For pH 5 and pH 6 the protein peaks are shifted to slightly larger hydrodynamic radii, indicating the presence of a higher fraction of oligomers than for the other formulations. In addition, pH 5 and pH 8 conditions result in the presence of larger aggregates in the size range of 10–100 nm. A small fraction of even larger aggregate peaks in the micron-size range are present in all formulations and is due to particulates introduced during the protein purification process.
Figure 4 shows the comparison of particle sizes in the same buffer conditions for protein preparation B, which has the least amount of aggregates in the size range >10 nm and is thus the most stable in buffers ranging from pH 5 to pH 7.
This preparation results in a more uniform size for the protein monomer across all buffer formulations due to a lesser degree of oligomerization. Furthermore, fewer aggregates are observed in the size range of 10–100 nm. Overall, protein preparation B is more stable than protein preparation A across a wider range of pH values.
A detailed comparison of the two different protein preparations at pH 5 is depicted in Figure 5, the sample in wells A25 and A26 show excellent reproducibility of the particle size for protein preparation A, as do wells A29 and A30 for protein preparation B. The aggregation peak at 23 nm observed for preparation A is completely absent in B, indicating a higher stability in the latter.
The screening results (summarized in Figure 6) display the protein monomer sizes vs. buffer conditions of the protein peak. The highest stability is found for protein preparation B in pH 7 and PBS buffers as indicated by the smallest protein sizes and highest percentage intensity.
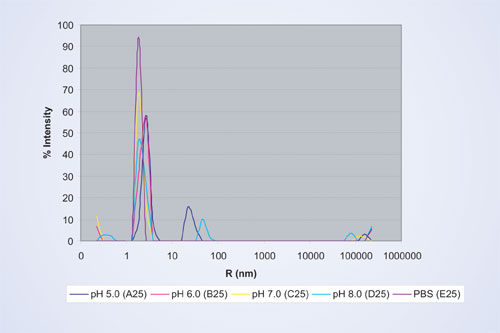
Figure 3
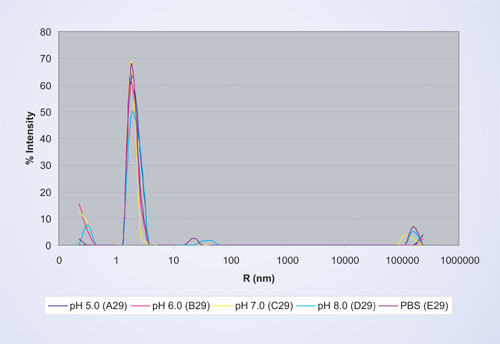
Figure 4
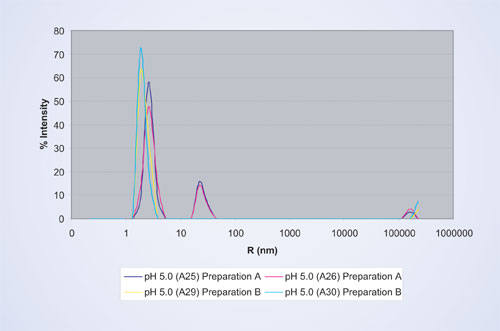
Figure 5
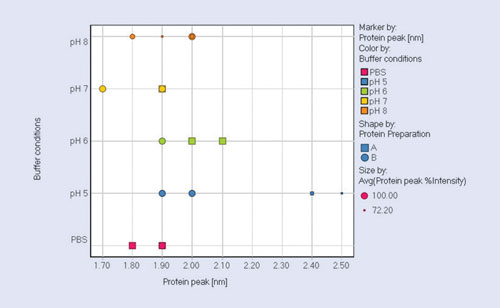
Figure 6
Conclusion
This study demonstrated the use of DLS for the screening and characterization of proteins. This method performed rapid and automatic screening for aggregates present in protein formulation and required low sample volumes, as little as 10 µL per well. It is also possible to use this technology to perform automated temperature studies for stability screening.
Sigrid Kuebler is an application
scientist at Wyatt Technology.
Web: www.wyatt.com.
E-mail: [email protected].


