
June 15, 2013 (Vol. 33, No. 12)
ANNOVAR® (1) provides flexibility to handle and analyze variant datasets of genomic scale. Here we make use of ANNOVAR®’s capabilities to understand a breast cancer variant dataset by applying its variant reduction functionality, combined with Genome Trax™’s (2) content for functional mapping to highlight cancer specific genes and variations.
Data
Breast cancer dataset (invasive ductal carcinomas), one of the two paired tumor/normal cancer samples (cell line: HCC1187) from Complete Genomics (3), SOFTWARE_VERSION 2.0.0.32.
Introduction
Given a list of variants with chromosome, start position, end position, reference nucleotide and observed nucleotides, ANNOVAR® can perform gene based, region based and filter based annotation. The annotated features are then utilized to reduce the pool of genomic variants and highlight the most significant variants in a short period of time. All publically available databases, as well as proprietary annotation resources like Genome Trax™, can be used by ANNOVAR® to identify functionally significant variations.
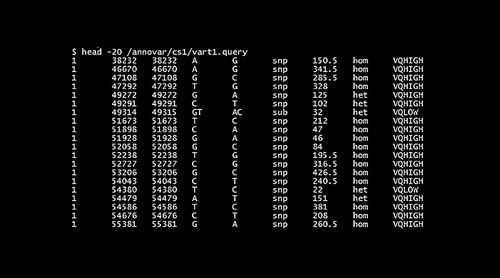
Figure 1
Analysis Workflow
The analysis procedure is based on the whole exome somatic variant profiling workflow suggested by Bernd Timmermann et al (4). In addition, individual genes which are already known to be biomarkers associated with breast cancer are separately analyzed.
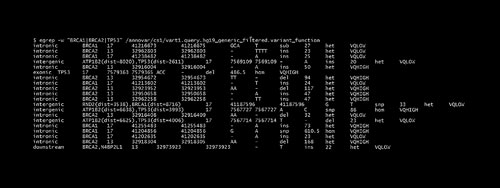
Figure 2
Data Download
Variant files from Complete Genomics public dataset HCC1187, build 37, are downloaded separately from tumor and normal directories. The files are named as GS00258-DNA_F01 and GS00258-DNA_E01, respectively. The extracted files are named as vart1.tsv for tumor set and varn1.tsv for normal.
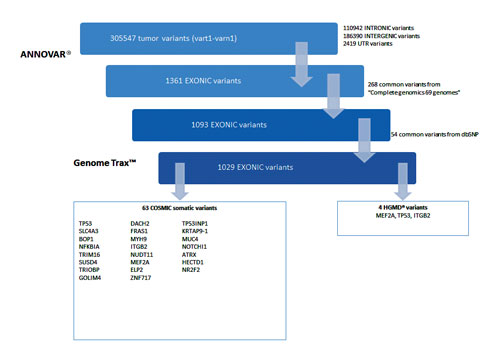
Figure 3
ANNOVAR®
ANNOVAR® perl script “convert2annovar.pl” converts the .tsv files to ANNOVAR® acceptable format for further analysis.
CODE: convert2annovar.pl -format cg -out vart1 vart1.tsv
CODE: convert2annovar.pl -format cg -out varn1 varn1.tsv
To isolate tumor specific variants, the germline variants from varn1 can be removed by considering the varn1 file as a generic database file (Figure 1).
CODE: annotate_variation.pl -dbtype generic -genericdbfile varn1 vart1 –buildver hg19
The file containing filtered results “vart.hg19_generic_filtered“ is used as input for gene based annotation which extracts variants in the exonic, intronic, intergenic and other regions.
CODE: annotate_variation.pl -geneanno vart1 -buildver hg19
The result file “vart1.hg19_generic_filtered.exonic_variant_function” contains all exonic variants and “vart1.query.hg19_generic_filtered.variant_function” contains all variants in intronic and other regions. Using the “grep” function, specific genes can be searched within the variant function file. For example, high breast cancer risk genes such as TP53, BRCA1 and BRCA2 are searched (Figure 2).
In order to remove those exonic variants that are commonly observed, the file is filtered using Complete Genomics 69 genome database with a Minor Allele Frequency 0.05.
Note: Download cg69 from ANNOVAR® as:
CODE: annotate_variation.pl -downdb -buildver hg19 -webfrom annovar cg69
Note: For the cg69 filtering step, extract and use only columns 5 through 13 from the exonic variant file.
CODE: annotate_variation.pl -filter -dbtype cg69 vart1.hg19_generic_filtered.exonic_variant_function -buildver hg19 /
Additional common variants from dbSNP are removed directly using ANNOVAR® by mapping against the “NonFlagged” dbSNP database, which can be downloaded using the –webfrom procedure in ANNOVAR® ($ perl annotate_variation.pl -downdb -buildver hg19 -webfrom annovar snp137NonFlagged
Extending beyond simple removal of common variants, Genome Trax™’s data tracks can be downloaded in .gff format and used as database files for the region based annotation procedure in ANNOVAR® in order to further filter variants of significant interest.
CODE: annotate_variation.pl -regionanno -dbtype gff3 -gff3dbfile /genometrax_hgmd_hg19.gff vart1.hg19_generic_filtered. exonic_variant_function_analysis -gff3attr -buildver hg19
As an example, we used Genome Trax™ data tracks for the COSMIC and HGMD® databases to further filter the set of significant variants, in combination with more general tracks.
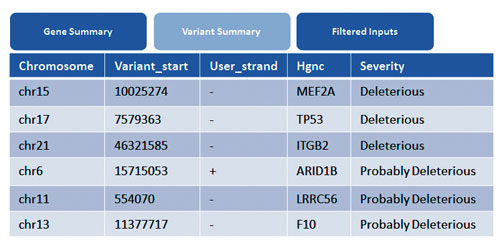
Figure 4
Results
The analysis demonstrates that the mapping of ANNOVAR® variants to functional features via Genome Trax™ and other data tracks results in compelling variants assigned to exonic, intronic, intergenic and other regions that warrant further analysis to identify the most promising variants.
The exonic variants are mapped to disease associations from the COSMIC and HGMD® databases. Among the genes which are highlighted, MEF2A, TP53 and ITGB2 show deleterious effects. TP53 variation is mapped to an indel region known to cause Li-Fraumeni syndrome (Figure 3).
Mapping against the PROTEOME™ Disease biomarker track yielded 440 hits. The genes associated with breast cancer included LMX1A, ARHGEF5, CAD, CSH2, BAP1, DIP2C, and TOB1 (Figure 4).
An “ACT” to “GCG” substitution on chr3 33905598-33905600 is mapped to a phosphothreonine site within the apoptosis gene PDCD61P.
Further, variants present in the “upstream” and “splicing” regions are extracted from the refgene mapped file “vart1.query.hg19_generic_filtered.variant_function” after cg69 and common snp removal filters are applied. The analysis of resulting subsets is as follows:
- 1573 variants in the “upstream” region of the genes are mapped to TRANSFAC® tracks (Figure 5).
- 25 splicing variants are mapped to Genome Trax™ – HGMD® tracks
A “T” variant located on chr18 57013284 in the splice site of the LMAN1 gene was found in this data set. It’s possible its role in cancer is unclear, as a previously known G>C mutation at this site was only reported to be associated with deficiency in a coagulation factors V and VIII.
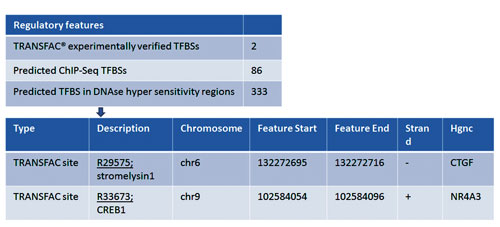
Figure 5
BIOBASE
100 Cummings Center, Suite 107A, Beverly, MA 01915
Alexander Kaplun, Ph.D.
+1 978-816-0134
[email protected]
Bhanu Bhargava
[email protected]
Karthick Lakshman
[email protected]
www.biobase-international.com
REFERENCES
1. ANNOVAR®: Functional annotation of genetic variants from next-generation sequencing data (2010) Wang K, Li M, Hakonarson H. Nucleic Acids Research 38: e164
2. Genome Trax™ (www.biobase-international.com/genome-trax) from BIOBASE Corporation
3. Human genome sequencing using unchained base reads on self-assembling DNA nanoarrays (2009) Drmanac R, et al. Science 327: 78
4. Somatic mutation profiles of MSI and MSS colorectal cancer identified by whole exome next generation sequencing and bioinformatics analysis. (2010) Timmermann B, et al. PLoS One 5(12): e15661


