
November 1, 2006 (Vol. 26, No. 19)
Temporal Measurement of Reactive Oxygen Species Generation
Cell culture samples consisting of multiple cells provide only an average response rate to manipulation. Whole cell populations thereby miss unique responses of cell subpopulations. Scientists could benefit from the ability to study each cell individually and observe real-time responses to a drug or an experimental condition. Analytical technology used in cell-based assays has progressed to the point where cell populations can be observed at single-cell resolution. Advanced high-content analysis (HCA) techniques enable individual and sequential cell measurements, but they require expensive instrumentation and can be used only with adherent cells.
To overcome these limitations, the first slide-based HCA tool to facilitate the study of individual, living, adhering, and nonadhering cells within a cell population was developed. In addition, real-time data collection may be conducted on individual cells throughout the process of interventions, such as exposure to drugs or altered experimental conditions.
The NUNC (www.nuncbrand.com) LiveCell Array microscope slide contains a compact array of picowells that are available in four sizes. The 15-micron and 20-micron diameter wells accommodate individual cells, such as cell lines, primary blood cells, primary bone marrow cells, and beta cells. The 100-micron and 250-micron diameter wells accommodate large cells or groups of smaller cells. Common cells for these larger picowells include plant cells, neuronal cells, cell clusters, including islets of langerhans and neurospheres, and tissue-like cell aggregates.
The array and its sliding cover slip (Figure 1) are made of glass and embedded in a plastic slide frame. Cells are applied to the array and covered with the sliding cover slip. Wash solutions, dyes, and treatments are applied to a raised area at the edge of the cover slip, and fluid is drawn by capillary action over the cells.
The LiveCell Array can be used with any standard upright or inverted microscope and allows scientists to easily perform HCA using a minimal number of cells and costly reagents. In addition, it offers the researchers the ability to:
• perform long-term, nonintrusive, and repeated measurements on intact, living, adherent, or nonadherent cells;
• study heterogeneous cell populations to observe individual responses to treatment and rare events;
• perform multiple functional assays on living cells followed by postfixation studies on the same cells, as well as correlate between data sets (e.g., intracellular immunoassaying);
• perform kinetic measurements of nonsynchronous activities in individual cells observing each cell;
• perform measurements on a cellular-to-molecular level, correlating whole cell measurements with molecular events; and
• analyze and compare actual measurements of subpopulations and individual cells, rather than use mean values of entire populations.
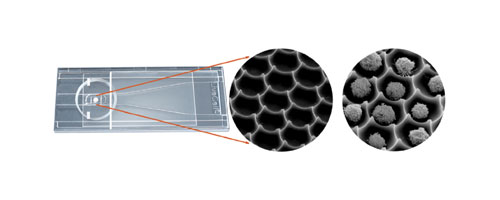
Figure 1: NUNC LiveCell Array microscope slide. Inset: SEM images of picowell array, empty and loaded with cells
Reactive Oxygen Species
To illustrate the unique function of the LiveCell Array, selected data from recent findings demonstrating temporal measurement of the generation of reactive oxygen species (ROS) in identifiable individual cells was presented.
ROS are involved in multiple physiological responses through modulation of signaling pathways. These free radicals and their metabolites induce both positive and negative cellular effects through complex metabolic pathways.
The LiveCell Array was used to simultaneously and directly determine their production dynamics and concentrations in each living cell.
Promonocytic U937 cells were stained with 10-µM dihydrorhodamine123 (DHR123), a dye used to assess intracellular levels of ROS, and loaded into the Live Cell Array. Each cell occupied a single picowell and did not change its original location upon staining or washing. A 50-µM hydrogen peroxide (H2O2) solution was applied to the cells to stimulate ROS generation, and data was obtained before and after a 30-minute exposure.
Figure 2 shows brightfield and fluorescence images of U937 promonocytes stained with DHR123 and an SEM micrograph of U937 cells within the array. Positive staining is observed in most cells, although intensity is not uniform. The subcellular distribution of DHR123 shows the staining pattern of the mitochondria, which was found to be highly heterogeneous within a cell population.
The LiveCell Array enabled real-time monitoring of fluorescence intensity (FI) changes in individual U937 cells during probe loading and following exposure to H2O2. In Figures 3A and B, representative scatter diagrams of FI for groups of individual U937 cells initially stained with DHR123 and then exposed to H2O2 are shown. An increase in FI was detected immediately following exposure to H2O2, shown in Figure 3A.
Control cells incubated with medium alone showed only a slight increase in FI due to basal endogenous generation of ROS (Figure 3B). Each dot represents the FI of one individual cell at a given time point. The mass centers of FI values for each cell group were obtained for each time point and are indicated with an open circle. Arrows indicate the time point at which the cells were exposed to the probe and H2O2 in Figure 3A and the probe and medium alone in 3B.
Figure 3C shows the rate of ROS generation in two individual cells, after exposure to H2O2. It can be seen that although the cells exhibit similar basal levels of intracellular ROS, they differ considerably in their FI rates upon stimulation.
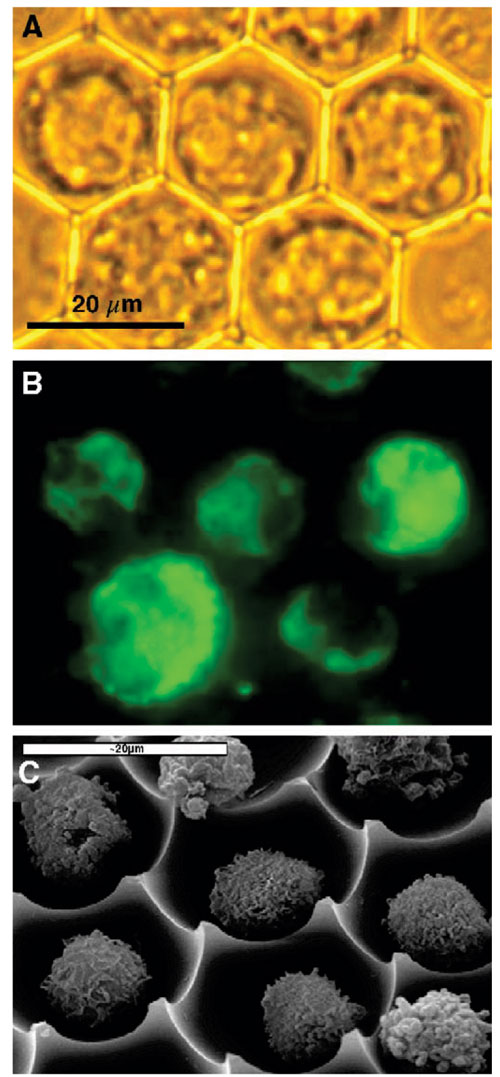
Figure 2
Membrane Potential
Correlation between ROS production rate and mitochondrial membrane potential (MMP) for individual cells was evaluated in cell populations dual stained with tetramethylrhodamine methyl ester (TMRM) for MMP and with 2,7-dichlorofluorescein diacetate (DCF-DA) for ROS. After probe loading, cells were exposed to 20-µM lysophosphatidylcholine (LPC) to stimulate ROS generation and sequentially measured at two wavelengths. Figure 4 shows the brightfield image and fluorescence images of the same U937 cells. Intracellular ROS levels were reported by changes in green FI, while changes in MMP were reported by changes in red FI.
The associated changes in intracellular ROS and MMP, measured in two representative cells exhibiting high and low ROS-production rates (cells 1 and 2, respectively), are shown in Figure 4D. High ROS generation rate was accompanied by rapid membrane depolarization, while a lower rate of ROS production was associated with hyper-polarization followed by a slower dissipation of the MMP.
The data shows that although all cells were exposed to the same concentration of stimulator, different individual cells exhibited distinct behavior with regard to their energy status, as reflected by their MMP. Individual cell analysis demonstrates that the subgroup of cells exhibiting the highest intracellular ROS production rates simultaneously displayed a significantly lower MMP.
The data also illustrates characteristics of ROS formation and the concomitant changes in MMP that are possible by individual cell analysis. The unique analytical capabilities of individual cell investigation enabled the real-time monitoring of free radical production in individual living U937 human monocytic cells line.
The ability to perform long-term, nonintrusive, sequential measurements on intact, individual cells, both adhering and nonadhering, in suspension is possible with the NUNC LiveCell Array. This technology has been successfully deployed in various cell-based assays, including measurement of intracellular enzyme kinetics and monitoring early apoptosis, all of which are performed in individual living cells.
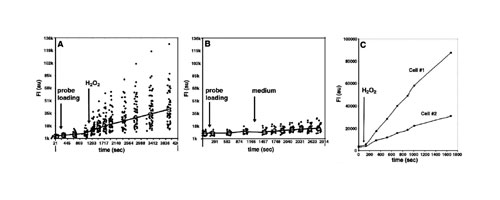
Figure 3
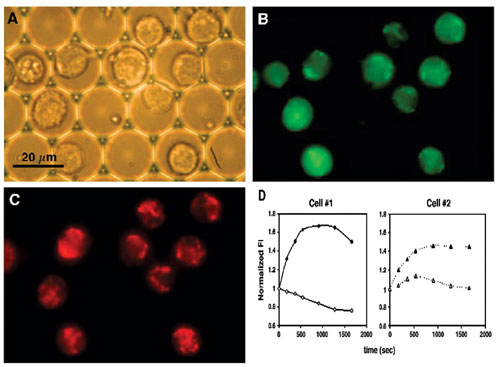
Figure 4
Sarah Haigh, Ph.D., is senior scientist of Molecular Cytomics, Dan Schroen, Ph.D., is product manager for drug discovery products at Nalge Nunc, and Naomi Zurgil, Ph.D., and Mordechai Deutsch, Ph.D., are from Bar-Ilan University. Web: www.nunc brand.com. Phone: (585) 586-8860. E-mail: [email protected]. Figures taken from N. Zurgil et al., Concomitant real-time monitoring of intracellular reactive oxygen species and mitochondrial membrane potential in individual living promonocytic cells, doi:10.1016/J.JIM.2006.07.013.


