
January 15, 2006 (Vol. 26, No. 2)
Processes Involved in Using DNA Microarray Instrumentation in Protein Microarray Workflow
Protein microarrays offer the ability to measure protein expression and antibody binding in a high-throughput and miniaturized manner. DNA microarrays (cDNA or oligos) have become commonplace and instrumentation is available to automate the workflow process of production, hybridization, and image analysis. The ability to use these instruments for protein microarrays increases their functionality and streamlines the process of generating data.
Protein microarrays have some unique features that may make DNA microarray instrumentation difficult to transition. Although some protein arrays are printed on coated glass slides in a manner similar to DNA microarrays, nitrocellulose-coated slides, such as Whatman FAST slides, are becoming the slide type of choice for many protein array applications. This is in large part due to the ability to produce mini Western blots, utilizing techniques researchers are familiar with. Use of nitrocellulose-coated slides for protein arrays poses some unique challenges, especially when using traditional microarray equipment.
Optimization of Protein Array Paramaters
A major problem with the optimization of protein array printing is the time and cost associated with the set-up and analysis of protein-protein interactions. Optimization using fluorescent dye eliminates the use of costly experimental samples in order to evaluate the optimization process. Using some type of fluorescent substance (e.g., red food dye resuspended in 1X PBS) to allow visual inspection of spot deposition is recommended. By scanning slides printed with red food dye in the Cy3 channel it is possible to get a high-resolution image of the spots to use for optimizing printing conditions.
Optimization of printing and wash protocols were performed using 5% red food dye in 1X PBS. Visualization of test prints were done using the Genomic Solutions (www.genomicsolutions.com) UC4 microarray scanner (Cy3 channel, AutoExp function, Glow green or Spectral setting). All test and protein printings were done using either SMP3 or SMP4 pins (TeleChem International).
In contrast to DNA arrays on coated glass slides, extra care must be taken when using nitrocellulose-coated slides to preserve the integrity of the slide coating because the surface can easily be damaged with only minimal contact with array pins. To ensure sufficient contact with the slide to allow release of liquid from capillary while avoiding damage to the surface, the contact of the pin to the surface can be calibrated in the Genomic Solutions OmniGrid Arrayer software via the Slide Origin calibration window. The Z Coordinate of the pin tip as it touches the surface can be finely adjusted (2.5 micron resolution) to optimize spot morphology.
The MicroGrid microarrayer has the ability to reduce the speed of travel of the print head before it reaches the slide surface. This allows for deposition of liquid from the pin while reducing the force of the contact of the pin to the surface. This Soft Touch feature is controlled via the MicroGrids TAS microarray software and slows the speed of travel of the pin tool from 100 mm/s to ~14 mm/s. By adjusting the height of the contact point on the OmniGrid or using Soft Touch on the MicroGrid good spot morphology can be maintained while preventing damage to the surface of the slide (Figure 1).
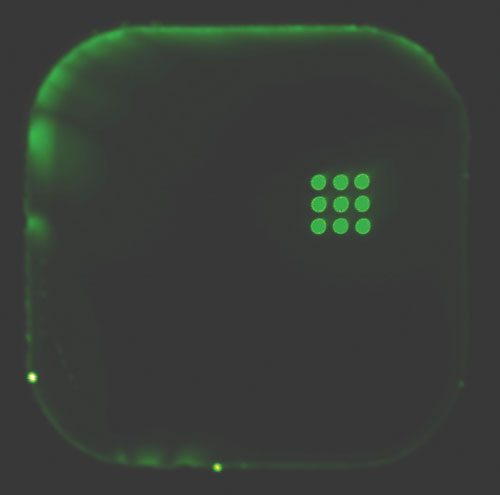
Cy3-labeled goat antirabit IgG(Amersham Bio) bound to rabit IgG (Invitrogen) on nitrocellose(Schleicher &Schuell). Image acqured using Genomic Solutions UC4 microarray scanner (Cy3 channel, AutoExp function, Glow Green setting).
Minimizing Carry-Over Contamination
Due to the composition and differing viscosity of various spotting solutions used for protein arrays, minimizing the amount of carry-over between spots is a critical step for successful protein arraying. The OmniGrid and MicroGrid microarraying systems allow for control over the wash steps and cycles.
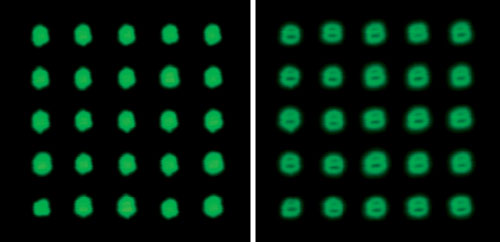
In order to establish a wash protocol that did not have carry-over, each dip into the dye sample was spotted six times onto the slides followed by the wash cycle, dipped into 1X PBS without dye and printed for an additional six spots. This was repeated three times. By varying the number of cycles through the sonication, wash, and dry cycles it is possible to develop a wash protocol that does not have any carry-over between samples (Figure 2).
The OmniGrid system has an on-board sonication and recirculating washing system to increase the effectiveness of the wash cycles. The MicroGrid system has two recirculating wash baths and uses the flood-and-flush method of cleaning the pins. Additionally, the two recirculating wash baths on the MicroGrid can be used as stationary baths, which can be filled with various cleaning agents such as ethanol.
Due to variations in printing solutions and concentration of proteins, sample-specific wash protocols will need to be determined empirically. By varying the times and number of cycles through the wash stations, it is possible to print proteins on nitrocellulose without any visible carry-over (Figure 2).
By adjusting the Slide Origin or using SoftTouch parameters, good spot morphology with no visible surface damage can be achieved (left image)
Protein-Protein Binding
When proper printing and wash protocols have been established, the next steps are printing followed by addition of the solution-phase binder. Protein arrays may have complex binding protocols involving multiple blocking and wash steps.
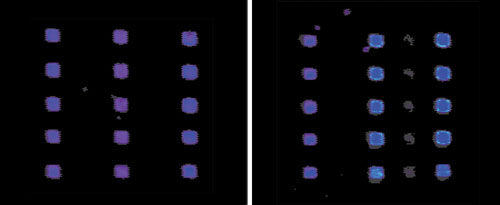
The Hybstation automates solution-phase binding procedures. In order to test printing protocols and subsequent use of the Hybstation, 5 mg/mL of rabbit IgG (Invitrogen) was spotted onto a single pad of 8-pad FAST slides in a 3×3 pattern, using printing and wash protocols established as above. Slides were then allowed to dry overnight in a dessicator.
Dried slides were placed in the hybridization module of the Hybstation and ~110 mL of 100 mg/mL of FluoroLink Cy3-labeled goat anti-rabbit IgG (GE Healthcare) resuspended in 1x PBS + 0.1% Tween 20, was used to probe against rabbit IgG bound to the slide. A standard protein solution-phase binding protocol was written using the Hybstation PC Editor software program of the Hybstation. Blocking, solution-phase binding, and wash steps were included in the protocol and antibody binding was carried out for 18 hours. Blocking and washes were done with 1x PBS + 0.1% Tween 20. The slides were allowed to air dry for 15 minutes prior to scanning. This basic program can be modified and adjusted with the Hybstation PC Editor software according to the individual researcher needs.
Scanning of Protein Arrays
Scanning of protein microarrays on membrane-coated slides poses unique problems. Often signals can be much weaker than those found on traditional DNA arrays, and those nitrocellulose has a high background fluorescence making it difficult to analyze on traditional microarray scanners. The UC4 scanner (Genomic Solutions) uses a Dark Field Imaging system. Dark Field optics eliminate the detection of reflected light from the surface of the slide, which is useful when scanning against the white surface of nitrocellulose slides. Additionally, the broad depth of field (+/- 100 mm across the 75 x 25 mm slide surface) compensates for any uneven substrate surfaces
One consideration when scanning protein array slides is that the gain setting will be lower than is used on DNA arrays because of the nitrocellulose coating. The automatic exposure capability (gain and background adjustment) of the UC4 software takes the guess work out of making proper scanner settings. This function automatically adjusts PMT gain versus background to produce the best image with low background. For the researcher who wants to control gain setting, manual gain control is also possible.
Slides printed with 5 mg/mL rabbit IgG and hybridized with Cy3-labeled goat anti-rabbit IgG hybridized as above were scanned on the UC4 microarray scanner using the Auto Exposure function on the Cy3 channel. The images produced were well-suited for data analysis (Figure 3).
Testing wash protocols on the Omngrid arrayer on FAST slides. Genomic Solutions UC4 scanner used, Spectral color setting (Cy3 channel). The wash protocol used on the left shows no fluorescence in the columns printed with 1X PBS (no dye).


