
November 15, 2009 (Vol. 29, No. 20)
J.C. C. Mason Ph.D.
Managing Complexity through Proper Instrument Design
Life science researchers first learned of the utility of flow cytometry as a result of Prof. Wolfgang Göhde’s pioneering work at the University of Münster in the late 1960s and early 1970s.
Leonard Herzenberg, Ph.D., professor at Stanford University, expanded the technique and introduced the term fluorescence-activated cell sorting (FACS).
Flow cytometry has since grown considerably in both complexity and breadth of applications. Modern instruments combine highly diverse technologies, including fluidics, flow cells, lasers, optical detection systems, electronic signal processing, and software for system control and data analysis. All must be optimized, precisely matched, and work in perfect unison for optimal instrument performance.
“Simplexity”, which describes the complementary relationship between simplicity and complexity, seems apropos for the translation of flow cytometry potential into practice. Today’s flow cytometers are far more complex than their predecessors of even a decade ago. Yet, they are easier to operate, thanks to advanced hardware design and software features.
Today’s high-performance flow cytometers are a considerable investment for research laboratories. The range of choices in features and instrument design can be intimidating but can provide a significant return on investment in adaptability and future flexibility.
Myriad Applications
Flow cytometry has emerged as a powerful tool in the life sciences. In molecular biology, when used with fluorescence-tagged antibodies, the technique is employed primarily to identify cells (phenotyping) and to acquire specific cellular functional information. While the most common research application is multicolor immunophenotyping, flow cytometry can be used in medicine for such diverse applications as HIV research, vaccine development, leukemia and lymphoma studies, investigations into graph-versus-host disease, tumor immunology, and autoimmune disorders.
In addition to identifying specific cells, flow cytometry has aided studies of cell activation, stem cells, cell signaling, cell development, and apoptosis. Although the majority of applications exploit the identification of fluorescent markers on the surface of cell membranes, flow cytometry also detects and analyzes soluble proteins or analytes inside the cell, thus providing information at the protein-cell level.
In marine biology, flow cytometric characterization of the autofluorescent properties of photosynthetic plankton has uncovered the complex community structure of marine populations.
Every enabling technology associated with flow cytometry, including reagents and hardware, has grown with the diversity of flow cytometry applications. Today’s lasers provide a nearly unlimited variety of practical wavelengths and powers. With more colors to choose from, the analysis of the cell population(s) of interest becomes more specific.
Instrument Capabilities
Today’s most powerful flow cytometer cell analyzers support up to seven lasers simultaneously (from ultraviolet to infrared) and offer a broad selection of positional choices for detector placement. These cytometers meet the multicolor analysis needs of high-end research, where complex experiments often demand a combination of lasers, detectors, and bandpass filters to meet specific assay requirements.
Another desirable feature is a choice of power settings, which is useful in obtaining data from highly multiplexed fluorescent markers. Flexibility of laser choice enables the researcher to designate reagents based on maximal signal strength and minimal crosstalk due to spectral overlap (“spectral spillover”). This approach is especially useful for resolving cell populations with relatively few binding sites on the cell surface, which produces faint detection signals. As a result, the subsequent need for electronic adjustment (compensation) to account for spectral spillover is considerably reduced.
Highly multiplexed assay panels utilizing 10 or more fluorescent tags simultaneously present resolution and compensation challenges. An example is provided by the analysis of human lymphocytes by Frederic Preffer, Ph.D., associate professor of pathology at Harvard Medical School, published recently in Clinical Cytometry (Figure).
In this case, the relative intensities of the fluorescent tags varied significantly, making resolution particularly challenging. Using a flow cytometer with a seven-laser combination of UV (355 nm), violet (450 nm), blue (488 nm), green (532 nm), yellow (594 nm), red (638 nm), and infrared (785 nm), the researchers combined a spatially separated beam with an individual detection array.
This arrangement resulted in complete lymphocyte population separation with minimal computer compensation and spillover.
Since light is lost each time it passes through a filter, the pathway of the collected light becomes a critical consideration for collecting low-intensity signals. Using the BD™ LSR analyzer from BD Biosciences, emitted light travels to each photomultiplier via reflection and is transmitted through only two pieces of glass before reaching the detector. This allowed detection of more colors with minimal light loss.
In addition, pathways were arranged in octagon and trigon configurations designed to detect from the longest wavelength (red) to the shortest wavelength (blue). The dimmest fluorescent signal (red) was detected first to avoid passage through multiple optical components, and therefore maximize the available signal.
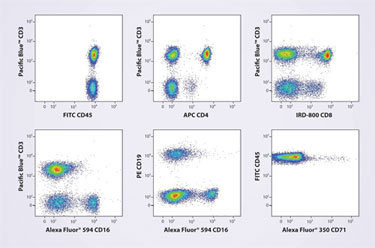
Seven-laser excitation of seven discrete fluorochromes
Practical Considerations
Long recognized as a constraint, space limitations are particularly acute at institutions where space cost is premium, e.g., in biocontainment facilities. Reducing the typically large footprint of flow cytometers has been difficult, considering the need to accommodate high-power, water-cooled lasers (e.g., argon, krypton).
However, advances in solid-state laser technology have allowed miniaturization of these components, with concomitant reductions in size for flow cytometers, while retaining high power and other desirable features. Modern flow cytometers now provide performance fully equivalent to much larger, earlier-generation instruments—in roughly half the footprint.
Preconfigured instrumentation is a growing trend fueled by the shortage of instrument specialists and time and workflow considerations. Laboratories that need to get the job done, but lack detailed knowledge of the inner workings of complex instrumentation, should consider purchasing preconfigured instruments.
The most common preconfigured flow cytometers incorporating up to four lasers enable operators to perform multicolor flow cytometry with a minimal learning curve. Instruments with four lasers (blue, red, violet, and ultraviolet) at recommended wavelengths, power settings, and with a defined set of optical filter combinations, can detect up to 18 colors simultaneously and meet most flow cytometry analysis needs.
Instrumentation should be supported by software capable of full instrument control, data analysis, and methods development. One desirable software feature is performance tracking (cytometer setup and tracking software), which routinely measures instrument settings and reports on whether performance is maintained at acceptable levels. Ideally, the software should establish baseline settings and account for variability between multiple instruments at the same laboratory.
Other essential features include the ability to generate performance (Levey-Jennings) plots, acquisition templates, user-definable experiment layouts, and automated spectral compensation. These capabilities reduce operator error and ensure consistency of results.
Simply put, today’s flow cytometers address a growing range of applications and deliver more data in a single experiment, while simplifying operation so that researchers can focus on scientific inquiry.
J. C. Mason, Ph.D. ([email protected]), is director of research
instrumentation and marketing at BD Biosciences. Web: www.bd.com.


