
June 1, 2016 (Vol. 36, No. 11)
Jayne Hesley Application Scientist Molecular Devices
Oksana Sirenko Ph.D. Molecular Devices
Implementing High-Throughput Confocal Imaging Using 3D Models
Increased demand for biologically relevant screening in order to discover efficacious nontoxic compounds at an earlier stage has driven a move to high-content assays. While assays for plate readers are optimized to isolate a particular pathway, high-content screening enables visualization of specific, toxic, and off-target effects in the same screen or workflow. The growing complexity in screening has generated higher demand for high-content, high-throughput instrumentation and improvements in acquisition and analysis.
Unlike monolayer-based models, spheroids mirror the 3D cellular context and therapeutically relevant pathophysiological gradients of in vivo tumors. Much like tumors, they contain both surface-exposed and deeply buried cells, proliferating and nonproliferating cells, and a hypoxic center with a well- oxygenated outer layer of cells. However, this three-dimensional structure presents unique assay development challenges, including:
- Optimizing the compound and staining treatment to ensure dye penetration and avoid disturbing the spheroid integrity
- Acquiring representative images throughout the 3D structure
- Analyzing the resulting images to accurately segment and score
Spheroid Formation
We used the following method to form spheroids from cancer cell lines HCT116, DU145, and HepG2. Cells were cultured in flasks at 37°C and 5% CO2 before detaching and seeding into 96- or 384-well black plates with clear bottom ultra-low attachment U-shaped wells at densities of 1,000–1,500 cells/well in the appropriate media supplemented with fetal bovine serum (FBS). Within 24 hours, a single spheroid formed in the bottom of each well and continued growing in size until it was used for experimentation after 2–4 days at 37°C and 5% CO2.
Spheroids may be cultured longer but the increasing size may impede stain penetration and imaging of the center-most cells. Spheroids were treated with anticancer compounds Etoposide, Paclitaxel, and Mitomycin C. Treatment began by adding compounds into the wells at 10x concentration then incubating for 8–24 hours or 3–7 days, depending on the mechanism being studied. Shorter durations were used to study apoptosis and longer durations for multiparameter cytotoxicity studies. For drug treatments longer than 2 days, compound was refreshed every 2 days at a 1x concentration.
Optimizing Compound and Staining Treatment
Spheroids present several staining challenges. Tightly packed cells may impair dye penetration, especially of labeled antibodies. Washing might disrupt spheroids that have been affected by compounds, so dyes or protocols that require washing may be problematic.
The examples shown here are from the development of an HCT116 spheroid assay for evaluating spheroid morphological changes in addition to the incidence of apoptotic cells in the well. After the compound treatment was completed, stains were combined into a single cocktail at 4–6x concentration and added directly to the media in the wells. Stains that require no washing were chosen to avoid disturbing the spheroids. The optimized stain concentration may be 2–4x the concentration normally used in 2D cell culture.
An optimized one-step staining protocol was used which does not require fixing cells or repeated washes. Calcein AM was used to measure metabolically active cells, viability, and a variety of morphological parameters. Hoechst was utilized to measure total cell count and nuclear shape. Ethidium homodimer (EthD-1) selectively penetrates cells with damaged outer membranes and was used to measure dead or necrotic cells.
Final dye concentrations in the well were: Hoechst 15 μM, EthD-1 3 μM, and calcein AM 1 μM. Images of Hoechst, calcein AM, and EthD-1 were taken using DAPI, FITC, and Texas Red channels respectively. (In the alternative protocol cells were fixed using 4% formaldehyde, permeabilized with 0.02% saponin and stained with Hoechst and AF488-conjugated Phalloidin.)
Imaging Spheroids
Spheroids were visualized using the ImageXpress® Micro Confocal High-Content Imaging System at either 10x or 20x magnification. Confocal optics provide the ability to image a thinner optical section of the spheroid than widefield optics. This significantly reduces the amount of background haze produced by fluorescence-emitting objects above and below the plane being acquired.
It also allows better resolution of fine detail either at the subcellular level or between cells that are clustered or stacked upon each other as they are within a 3D structure. More accurate segmentation is often possible using a confocal image. In repeated experiments with spheroids, segmentation of nuclei from confocal images yielded counts ~20% higher than nuclei counted in widefield images (data not shown).
In order to analyze responses of cells throughout the 3D structure, images were collected starting at the bottom of the spheroid, proximal to the plate surface and then at different heights within the body of the spheroid up to the widest diameter to create a “stack” of images. That stack of images was then combined or “collapsed” into a single 2D projection image using a mathematical algorithm which keeps the pixels with the brightest intensity in the stack to generate the projection (Figure 1). The individual z-planes were also saved for 3D analysis.
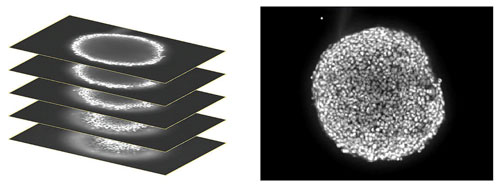
Figure 1. (Left) A stack of confocal images was acquired in the z plane spanning roughly half the depth of the spheroid. (Right) Only some cells of the spheroid are in focus at any given plane so, for ease of analysis, the images were collapsed into a single 2D image to combine the in-focus areas.
In the present study, 3D analysis of the images was done using new, integrated features of MetaXpress® High-Content Image Acquisition and Analysis Software. The new features in the software converts a stack of 2D images obtained using confocal acquisition into a 3D space with the appropriate detection and segmentation of objects in the volume.
Individual z-planes are first segmented and analyzed as 2D images, e.g. for nuclei count, live-dead, scoring, or other type of analysis, then the objects are “connected by best match” with the user-defined parameters such as maximum displacement of each object. As a result, nuclei or individual cells are segmented and scored in the 3D volume (Figure 2).
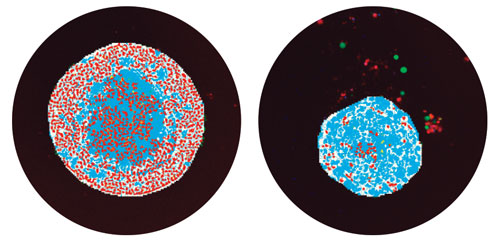
Figure 2. Segmentation masks showing identification of spheroids in teal and live nuclei in red. (Left) Control spheroid with numerous live cells identified. (Right) Spheroid treated with 300 nM Mitomycin C shows a decreased number of live cells and a reduced spheroid size.
Screening Anticancer Drugs with an Apoptosis Assay
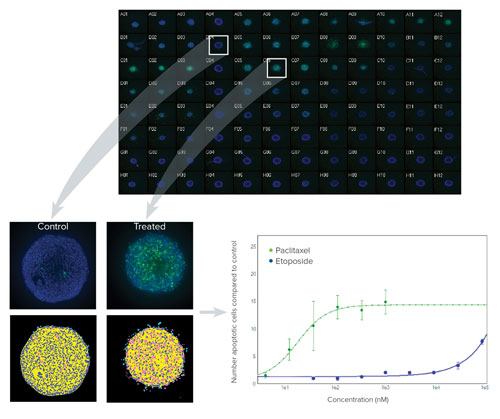
One class of anticancer drugs targets the extrinsic pathway of apoptosis to trigger cell death. To demonstrate an assay for apoptosis, HCT116 spheroids cultured in 96-well plates for 3 days were treated with a dilution series of 4 different anticancer compounds for 24–48 hours. After the compound treatment was completed, apoptosis was detected using both a detection reagent sensitive to caspase-3/7 as well as a mitochondrial dye. A 4x cocktail of the combined stains, including Hoechst nuclear stain, was added to the media in the wells. An optimized one-step staining protocol, which does not require fixing cells or repeated washes, was used to maintain spheroid integrity (Figure 3).
Figure 3. (Top) Montage of image thumbnails of HCT116 spheroids in a 96-well plate treated with compounds and imaged with a 10x Plan Fluor objective. Hoechst stained nuclei (blue) are overlaid with CellEvent Caspase 3/7 apoptosis marker (green). Untreated controls are in column 4 and a Caspase 3/7 response is evident in columns 5–7 where Paclitaxel was serially diluted 1:3 from 1 uM in Row A (replicates of 3 across). (Left) Eleven z planes were combined into a 2D Maximum Projection image and analyzed with a simple custom module. Raw images showing low and high degree of apoptosis with their corresponding segmentation masks are shown (royal blue=nuclei, pink=apoptotic cells). (Right) By normalizing the amount of apoptosis as compared to untreated spheroids and plotting on a graph, it can be seen that Paclitaxel (green line) induces apoptosis at a much lower concentration than Etoposide.
Rapidly Screen 3D Spheroids in Microplates
The ability to use human cancer cell spheroids in a high-throughput, high-content imaging environment is a significant step in facilitating more relevant testing of chemotherapeutic drug candidates. The ImageXpress Micro Confocal system and MetaXpress software allows for rapid imaging and analysis of 3D spheroids in microplates for monitoring induced apoptosis and mitochondrial toxicity of anticancer drugs.
Jayne Hesley ([email protected]) is an imaging applications scientist and Oksana Sirenko, Ph.D., is a research scientist, R&D, at Molecular Devices.
For additional information on optimizing acquisition parameters of these spheroid screening assays, refer to the paper:
Sirenko O., Mitlo T., Hesley J., et al. High-Content Assays for Characterizing the Viability and Morphology of 3D Cancer Spheroid Cultures. Assay and Drug Dev. Technol. 2015;13:402–414.


