
January 1, 2007 (Vol. 27, No. 1)
Anniek De Witte
Christopher Rizzo
Francisco Cifuentes
Analysis of DNA Copy Number Changes Using 60 mer Oligo-based Microarrays
Chromosome rearrangements are commonly associated with multiple disease states such as cancer and many developmental syndromes, including Down’s syndrome and autism spectrum disorders. The identification and analysis of these genomic rearrangements has been instrumental to the advancement of research in these areas as well as disease diagnosis. Researchers and clinicians can employ several techniques to detect chromosome changes, including karyotyping, FISH (fluorescence in situ hybridization), SKY (spectral karyotyping), and conventional CGH (comparative genomic hybridization).
However, each of these techniques is low-throughput, extremely labor-intensive, and often requires specially trained staff to perform tests in a consistent manner. Another major technical disadvantage is low genomic-mapping resolution along the chromosome, where only large chromosomal aberrations (on the order of MB) can be easily identified.
Microarray-based Methods
Microarray-based CGH (aCGH) techniques have revolutionized the field of chromosomal variation detection and deliver KB resolution (and even smaller, in some cases). They have become the method of choice for detection of copy number changes in tumors and genetic disorders. At first inception, aCGH techniques were dependent upon the use of cDNA probes or BAC (bacterial artificial chromosome) clones. They addressed issues of resolution and throughput, but have limited commercial availability and inconsistent quality, and, as with karyotyping and the FISH methods, still require significant human and technical efforts for array manufacturing, clone library maintenance, and validation.
Moreover, because cDNA and BAC-based probes are too long to ensure specific hybridization, they fall short in delivering the high-resolution required for accurate detection of focal chromosome alterations.
Recent advances in CGH technology, including the use of printed oligonucleotide arrays, have enabled reproducible, high-resolution examination of chromosomes with a high level of detail. In particular, the use of oligonucleotide probes has removed many of the limitations associated with cDNA and BAC arrays.
Oligonucleotide microarrays allow detection of large or focal amplifications and deletions, copy number boundary delineation within the genome, and chromosomal variation characterization.
However, few platforms are specifically targeted for CGH applications. Because the complexity of the genome is around 100 times higher than that of the transcriptome, many of the assumptions made for gene expression-designed probes are not valid for CGH purposes. Furthermore, probes that have been designed for other applications, such as single nucleotide polymorphism (SNP) detection or gene expression profiling, are not likely to give the same level of robust performance, thus compromising final data quality.
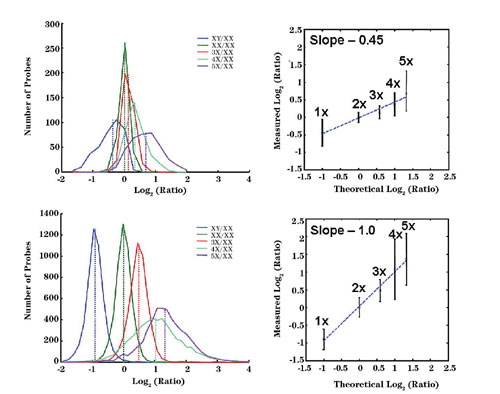
Figure 1
Optimization of Oligo aCGH Probes
To address these issues of specificity and robustness, a multivariate set of unique probe design algorithms and in silico probe-selection criteria were developed specifically for the CGH application. The algorithms employed for probe design are optimized to accurately detect DNA copy number changes. The CGH probe sets were compared, with respect to resolution and efficacy, to those created for gene-expression microarrays.
Unlike with gene expression microarray probes, CGH probes are not confined to 3´ ends of expressed sequences, and can span intronic and intergenic regions. Special care was taken to select probes with a narrow Tm (melting temperature) range to ensure optimal performance and specificity for all the probes at the given hybridization and wash conditions.
A prototype CGH microarray with coverage on Chromosomes X, 18, 17, and 16 was compared side-by-side against gene-expression microarrays. In this comparison, a multitude of cell lines with various copy numbers of Chromosome X (up to 5 copies) was used. Figure 1 shows the significantly higher accuracy in copy number detection seen with the CGH-designed microarrays as compared to those designed for gene-expression analysis.
Such improved performance highlights the importance of application-specific probe design strategies. Additional experiments using other cell lines and a male/female model system were used to further improve algorithms and probe design and selection. These optimized algorithms were used to build the final Agilent (www.agilent.com) 244K Human CGH microarray, which has an average resolution of 6.4 KB. A database containing 8 million probes was also designed with the same tools, opening the possibility of reaching a resolution of ~200bp for specific regions of interest.
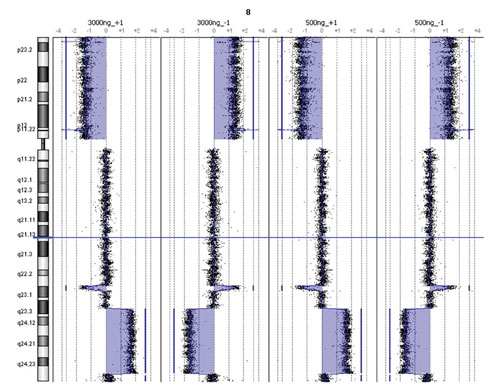
Figure 2
Reduced Genomic DNA Sample Input
Another potential obstacle to obtaining reliable, high-quality aCGH data is the limited amount of available target material. Certain techniques, such as needle biopsy or laser capture microdissection, often yield submicrogram quantities of gDNA. The current genome amplification methods used to overcome the limitations of sample size also introduce the risk of biased amplification and possible introduction of artifactual aberration calls.
To establish that a modified low-input aCGH protocol could deliver the same high-quality data as a previous high-input protocol requiring larger sample quantities, a series of hybridizations was undertaken. The modified protocol had already undergone previous validation on the Agilent aCGH platform with gDNA from commercial sources and gDNA isolated from various cell lines.
Protocol
Duplicate hybridizations in both positive and negative dye-swap polarities were done with gDNA from a female colon carcinoma cell line, using pooled normal female gDNA as a reference sample. Each protocol was evaluated for its ability to successfully detect known chromosomal variations in the colon carcinoma HT29 cell line. The HT29 line is well-characterized with documented, well-known chromosomal aberrations.
HT29 gDNA was isolated from cultured cells with the DNeasy Tissue Kit (Qiagen(www.qiagen.com)) using the supplier’s provided protocol. DNA quantity and quality were assessed by UV/Vis spectroscopy with the ND-1000 Spectrophotometer (NanoDrop Technologies(www.nanodrop.com)) and the PicoGreen® dsDNA fluorometric assay (Invitrogen(www.invitrogen.com)), in addition to gel analysis on 0.8% agarose E-gels® (Invitrogen). Low-input (requiring 500-ng gDNA) and high-input (requiring 3-µg gDNA) protocols were performed simultaneously. The low- and high-input protocols are profiled in the Agilent “Oligonucleotide Array-based CGH for Genome DNA Analysis” guides.
Appropriate cyanine 5- and 3-labeled DNA sample pairs were combined and then mixed with 50 µL of 1 mg/mL human Cot-1 DNA (Invitrogen), 52 µL of Agilent 10X Blocking Agent, and 260 µL of Agilent 2X Hybridization Buffer in a total volume of 520 µL. Prior to hybridization, the samples were heated at 95°C for 3 minutes and then incubated for 30 minutes at 37°C. 490 µL of the labeled target solution was then hybridized to Agilent’s 244K Human Genome CGH microarrays in SureHyb hybridization chambers rotated at 20 rpm for 40 hours in a 65°C oven. After hybridization, the microarrays were washed and dried. Microarray slides were immediately scanned on the Agilent Microarray Scanner.
Data for individual features on the microarray were extracted from the scan image using Agilent Feature Extraction 9.1 Software. Output files were imported into Agilent’s CGH data-analysis software, CGH Analytics 3.4. To interpret microarray performance, CGH Analytics generates a set of quality metrics including: signal intensity, background noise, signal-to-noise ratio, reproducibility of replicate probes, and probe-to-probe log ratio noise (DLRSpread).
To assess overall CGH platform performance with reduced sample input quantities, the data from duplicate hybridizations in positive and negative polarities (dye-swaps) using female colon carcinoma gDNA pooled with normal female gDNA were analyzed with the Agilent CGH Analytics 3.4. Copy number changes representing a Chromosome 8p deletion and an 8q amplification were detected by both low and high input protocols (Figure 2).
Furthermore, a single copy amplification of Chromosome 18p as well as an 18q deletion was detected by both protocol methods. Lastly, both protocols detected a previously identified homozygous deletion at the Chromosome 16 ataxin-2 binding protein 1 (A2BP1) locus (RefSeq spanning 6.0–7.7 MB) implicated in familial neurodegenerative disease (Figure 3).
The identification and analysis of genomic variations and rearrangements is vital for the advancement of cancer and genetic disease research, as well as the diagnosis of such diseases. Our results demonstrate the effectiveness of combining aCGH-targeted probe design with protocol optimization to deliver a microarray-based CGH platform capable of precise, high-sensitivity molecular assessment across the entire human genome, even when target materials are limited.
This improved workflow can augment traditional cytogenetic and microscopy techniques, giving researchers a powerful tool for genome-wide scanning and pinpointing chromosome changes.
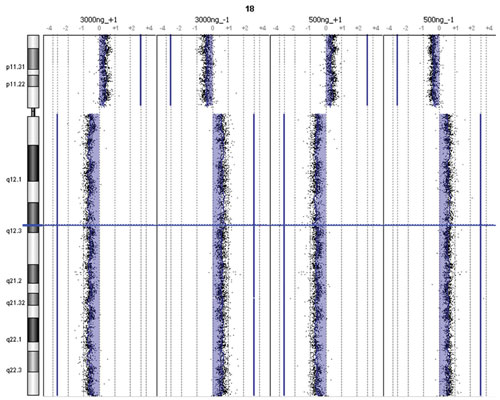
Figure 3


